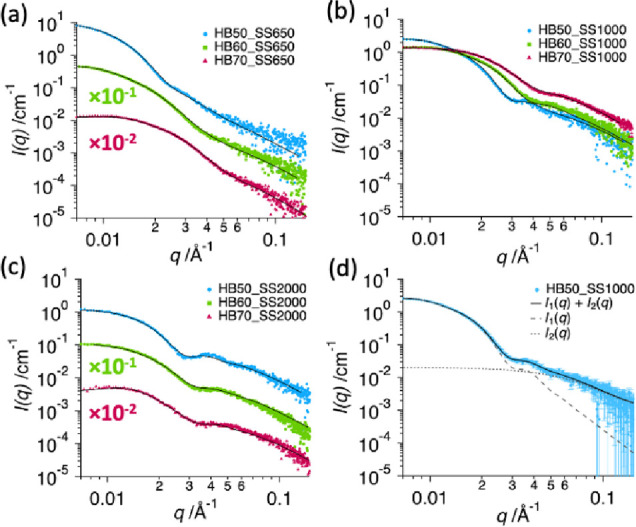
Figure 3.

SAXS profiles for 1 wt % aqueous dispersions of PU, composed of soft segment of Mn: (a) 650 g mol–1, (b) 1000 g mol–1, and (c) 2000 g mol–1, with hard block contents of 50 wt.% (blue circles), 60 wt.% (green squares), and 70 wt.% (red triangles). Some of the profiles are offset by the indicated multiplication factor to avoid their overlap. Solid curves show fitting of the SAXS model. Plot (d) shows, for a representative HB50_SS1000 PUD, the decomposition of the SAXS model fitting curve into scattering signals originating from two populations: spherical PU particles, I1(q) (dotted curve), and supramolecular PU structure, I2(q) (dashed curve).
