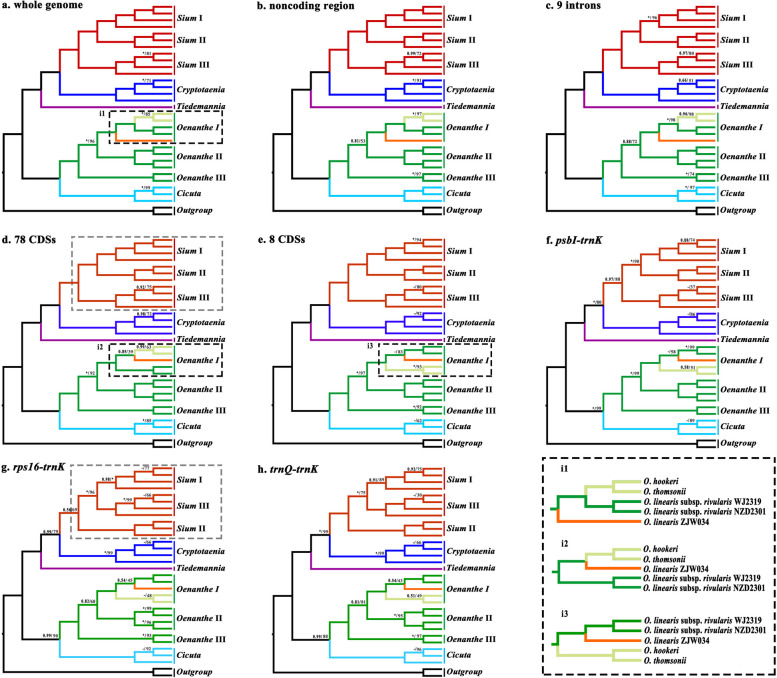
Fig. 5.
Comparison of eight phylogenetic trees. Phylogenetic tree each inferred from a, the whole genome matrix; b, the noncoding region concatenated matrix; c, 9 introns concatenated matrix; d, 78 CDSs concatenated matrix; e, eight CDSs concatenated matrix; f, psbI–trnK; g, rps16–trnK; h, trnQ–trnK. Support values marked above the branches follow the order Bayesian inference (PP, posterior probability)/maximum likelihood (BS, bootstrap support), * represent the best support (100%), - represent PP values < 50%. In the black dotted box at the bottom right are the three topologies of the Oenanthe I clade

