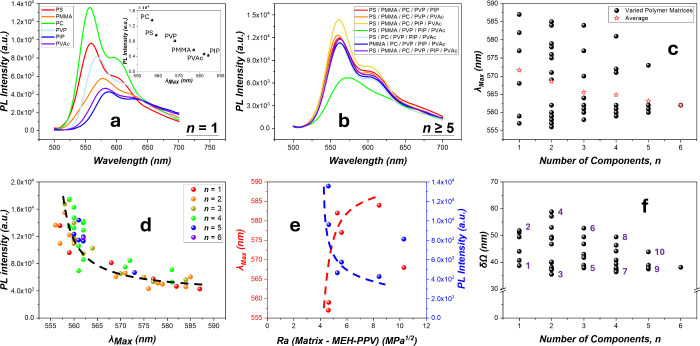
Figure 1.
PL spectra of 1 wt % MEH-PPV in the various matrices: (a,b) PL spectra in the n = 1 (a) and n ≥ 5 (b) polymer matrices. The PL spectra of other n’s are shown in Figure S3, Supporting Information B. (c) λmax vs n (the polymer compositions of each film can be seen in Figure 2). (d) PL intensity vsλmax for various n’s. (e) λmax and PL intensity vs Ra. (f) Breadths δΩ of the 0–0 peaks vs n’s. (1: PC, 2: PVAc, 3: PC/PIP, 4: PVP/PIP, 5: PC/PIP/PVAc, 6: PMMA/PIP/PVAc, 7: PC/PVP/PIP/PVAc, 8: PS/PMMA/PVP/PIP and PS/PMMA/PIP/PVAc, 9: PS/PMMA/PC/PIP/PVAc, and 10: PS/PMMA/PVP/PIP/PVAc).

