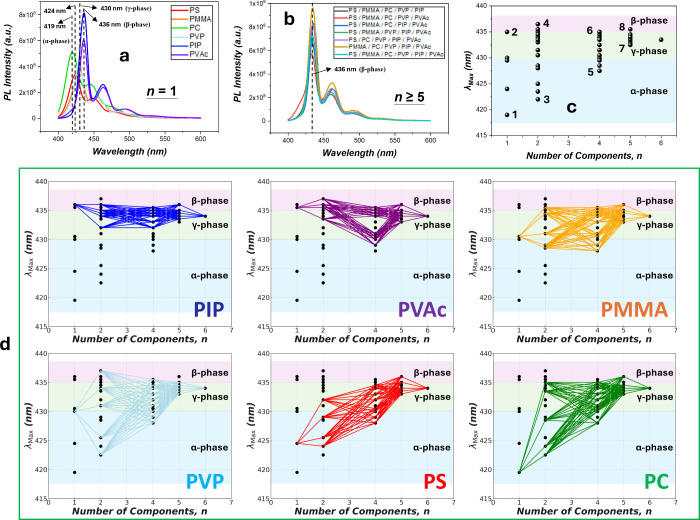
Figure 3.
(a) PL spectra of 1 wt % PFO in the various n = 1 matrices, showing distinct phase behaviors of the amorphous α-phase, γ-phase, and planar β-phase. (b) PL spectra of 1 wt % PFO in HEPs (comprising n = 5 and 6), exhibiting the formation of the β-phase. (c) λmax’s of 1 wt % PFO in the various polymer matrices. 1: PC, 2: PIP, 3: PC/PVP, 4: PVP/PVAc, 5: PS/PMMA/PC/PVP, 6: PMMA/PVP/PIP/PVAc, 7: PS/PMMA/PC/PVP/PVAc, and 8: PS/PMMA/PC/PIP/PVAc. (d) Tracing on λmax’s vs n for each polymer component.

