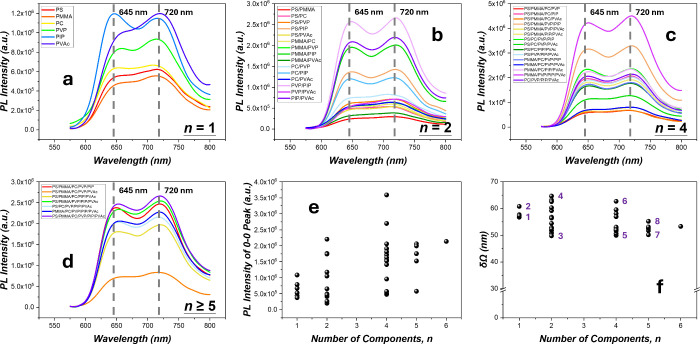
Figure 4.
PL of the 1.0 wt % P3HT-rr in the various polymer blends: (a–d) PL spectra in n = 1 (a), n = 2 (b), n = 4 (c), and n ≥ 5 (d) matrices; (e) PL intensity in the various matrices vs n. The PL intensity across all n's for every specific matrix species can be seen in Figure S9, Supporting Information G. (f) Breadth of the 0–0 peak δΩ in the different matrices vs n. 1: PIP, 2: PVP, 3: PVP/PIP, 4: PS/PVAc, 5: PS/PMMA/PVP/PIP, 6: PS/PMMA/PC/PVAc, 7: PS/PMMA/PC/PVP/PIP, and 8: PS/PMMA/PC/PVP/PVAc.

