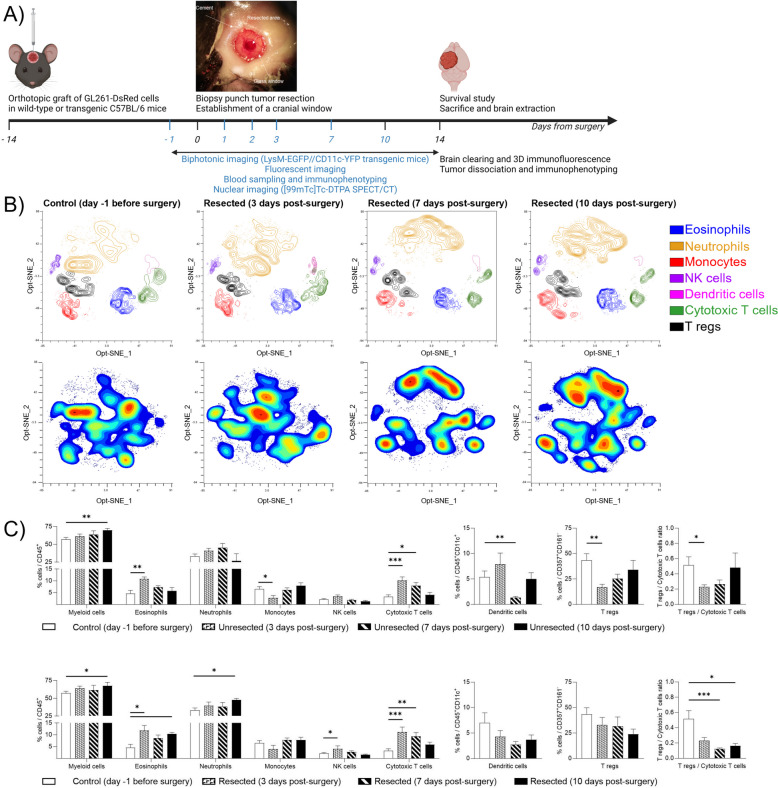
Fig. 1.
Longitudinal characterization of the impact of surgery on tumor recurrence: mouse model and systemic immune modifications. A) Time and work flow of the methods used in this paper to characterize longitudinally the systemic and local brain microenvironment from surgery to recurrence, as well as the post-mortem analysis performed to identify therapeutic targets in the microenvironment of recurrent tumors. The panel shows a light microscope image of the cranial window and resected area immediately after tumor resection; B) Identification of immune cell population in mice blood using flow cytometry. The upper panels show Opt-SNE of manually selected cell cluster validated by FlowSOM analysis for control and resected animals at day 3, 7 and 10 post-surgery. The lower panel represents, for the same groups of animals, the density contour plot of the different immune cell clusters in mice blood projected onto an Opt-SNE map; C) Frequency of repartition of blood immune cell clusters for control and unresected (upper panel) or resected (lower panel) animals at day 3, 7 and 10 post-surgery compared to day one before surgery. Numbers are expressed as percentage of cells related to CD45+ cells (for myeloid cells CD11b+, eosinophils, neutrophils, NK cells, Cytotoxic T cells), CD45+CD11c+ cells (for dendritic cells), CD357+CD161− (for Tregs). The right panel represents the ratio between Tregs and Cytotoxic T cells. (average ± SEM, n = 5–9; Kruskal–Wallis nonparametric analysis with uncorrected Dunn's test, *p < 0.05; **p < 0.01; ***p < 0.001)

