Fig. 4.
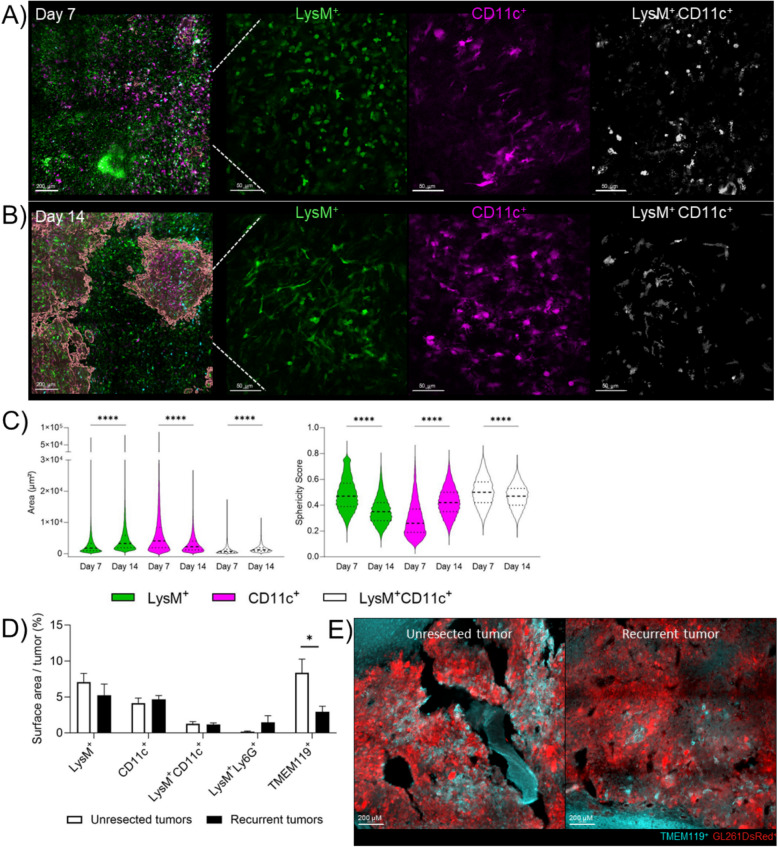
Post-surgical modulation of the brain and tumor microenvironment over time. A-B) Two-photon images at day 7 (panel A) and 14 (panel B) post-resection and cranial window implantation showing LysM+ cells (green), CD11c+ cells (purple), LysM+CD11c+ cells (white). The reconstruction of the tumor is represented in red in the left panels. Scale bar = 200 µm in the left panels, 50 µm in the three right panels; C) Violin plots representing the area (left panel) and sphericity score (right panel) of LysM+, CD11c+ and LysM+CD11c+ cells at day 7 and 14. The bar graphs represent mean ± SEM (n = 3 animals per group; paired nonparametric Wilcoxon test, ****p < 0.0001); D) Percentage of cells expressing LysM+, CD11c+, LysM+CD11c+, LysM+Ly6G+ or TMEM119+ in unresected or recurrent tumors at time of sacrifice (n = 3–4 animals per group; Mann–Whitney test *p < 0.05); E Representative pictures of TMEM119 staining in unresected and recurrent tumors, where tumor cells are GL261-DsRed+. Reconstitution, image analyses and cells quantifications were performed using Imaris software

