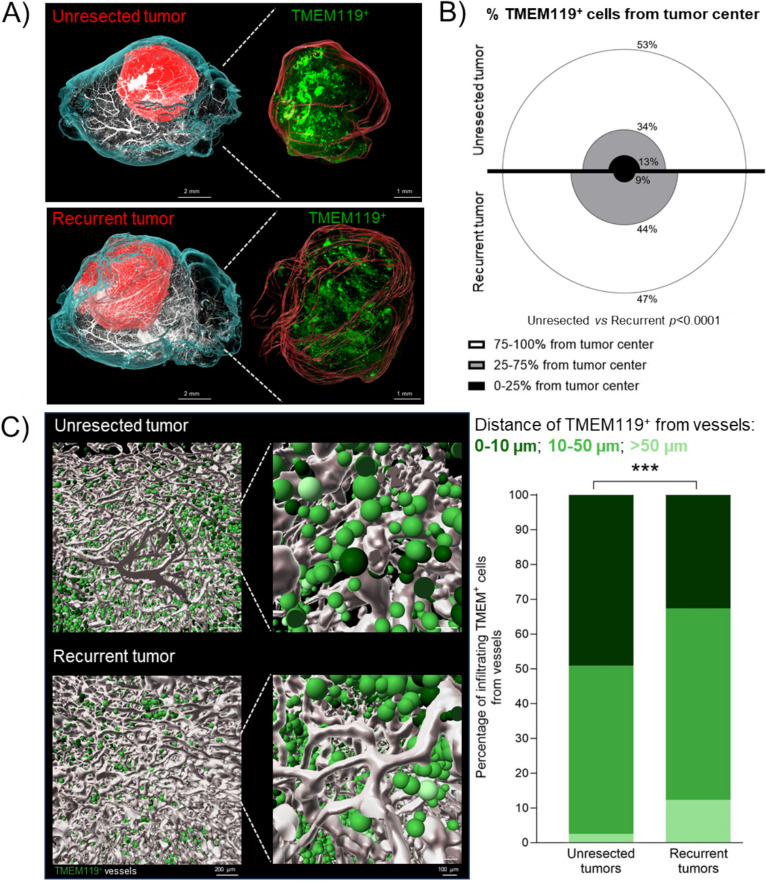
Fig. 5.
3D spatial characterization of the TMEM+ microglia distribution in unresected and recurrent tumors. A) Representative 3D light-sheet microscopy images of C57BL/6 mouse brains bearing GBM unresected and recurrent tumors (left and right panel, respectively). The hemi-brains were labeled for: blood vessels (CD31, Podocalyxin and a-SMA in white) and microglia (TMEM119, in green). The reconstruction of the brain and tumor are represented in cyan and red, respectively. Scale bar: 2 mm in left panel, 1 mm in right panel; B) Graphical representation of the percentage of TMEM119+ microglia from tumor center in each of the distance zone (n = 5; Chi2 test of independence); C) Graphical representations (left panels) and quantification (right panels) of the distance of TMEM119+ microglia from vessels (n = 5;Chi2 test of independence, ****p < 0.0001). Vessels are represented in white, and TMEM119+ in different shades of green (darker: 0–10 µm from vessels; medium: 10–50 µm; lighter: > 50 µm). Scale bar: 200 µm in each left panel, 100 µm in each right panel. Reconstitution and image analyses were performed by using Imaris software

