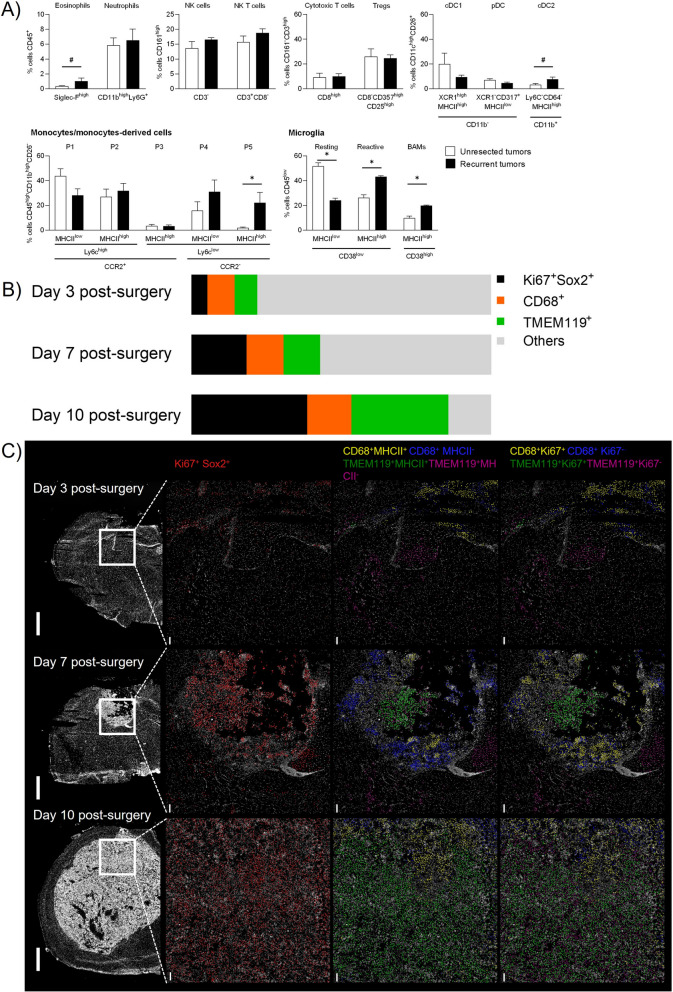
Fig. 6.
The immune landscape of unresected and recurrent tumors and the SMe. A) Multiparametric flow cytometry analysis of tumors using the gating strategy reported in Figure S8 (DC: dendritic cells; BAMs: border associated macrophages). Statistical analysis was performed using nonparametric Mann–Whitney test (mean ± SEM, n = 4–5; #p = 0.05, *p < 0.05); B) Percent of Ki67+Sox2+, CD68+, TMEM119+ among the total cells quantified in the region of interest of hyperplexed immunofluorescence images during GL261 recurrence development at day 3, 7, 10 post-surgery (average value from 3 different slices); C) Representative images of post surgical resection cavity in GL261-DsRed bearing animals imaged with MACSima technology during recurrence development at day 3, 7 and 10 post surgery (left panels, white DAPI staining). The right panels show the spatial location of Ki67+Sox2+ (middle left panel), CD68+MHCII+, CD68+MHCII−, TMEM119+MHCII+, TMEM119+MHCII− cells (middle right panel) and CD68+Ki67+,CD68+ Ki67−, TMEM119+Ki67+, TMEM119+Ki67− (right panel). Scale bar: 1 mm in left panel, 100 µm in the other panels

