

Abstract
Background
One of the main challenge for controlling the morbidity and mortality related to malaria is the absence of reliable treatment and precise diagnostic tools in malaria-prone regions. Despite the number of diagnostic techniques used, and inconsistent results were found from previous studies. The aim of this study is to assess the effectiveness of 18S nested PCR(Polymerase Chain Reaction),microscopy, and CarestartTMpf/pan RDT(Rapid Diagnostic Tests) as malaria diagnostic methods using Microscopy and 18S nested PCR as reference techniques.
Methods
A facilities and community based cross-sectional study was conducted in the villages of Batodegama kebele and Adama malaria control center from December 2016 to February 2017. A fingerprick blood sample was collected from each participant for the CarestartTM pf/pan RDT test, microscopy, and dry blood spot (DBS) analysis and 18S nested PCR assay. Data were analyzed using STATA11 to calculate the sensitivity, specificity, predictive values, and accuracy.
Results
Among the 128 asymptomatic patients, 26 (20.3%) were positive for malaria nested 18S PCR, 5 (3.9%) through RDT, and 8 (6.3%) through microscopy. From 202 symptomatic Patients, 55 (27.23%), 26 (12.87%), and 28 (13.86%) individuals were positive for 18S nested PCR, RDT, and microscopy, respectively. Comparative analysis of 18S nested PCR, microscopy, and CarestartTMpf/pan RDT have similar sensitivities of 50% and specificities of 100%.for diagnosing symptomatic malaria infections. Furthermore, species level analysis showed that 18S nested PCR has a higher detection rate of 26 (20.31%) than microscopy 8 (6.25%) and CareStartTM pf/pan RDT 5 (4.1%). The CarestartTMpf/pan RDT had a sensitivity of 15.4% and specificity of 98% in detecting asymptomatic malaria infections. However, the two methods have comparable sensitivities.
Conclusions
The 18S nested PCR assay showed superior performance in all circumstances. On the other hand, the overall performance of CareStart TM pf/pan RDTs was found to be comparable to that of microscopy. This finding highlights the value of parallel application of CareStart TM pf/pan RDTs and microscopy in a resource-limited setup.
Keywords: Microscopy, RDT, PCR, Malaria, Diagnostic tool
Background
Malaria remains a significant public health concern and results in high morbidity and mortality in developing countries [1]. It is transmitted by female Anopheles mosquitoes and caused by various Plasmodium species, including Plasmodium falciparum, Plasmodium vivax, Plasmodium malariae, Plasmodium ovale, and Plasmodium knowlesi [2]. Despite significant progress in reducing its morbidity and mortality, the disease continues to threaten a serious public health impact in the world [3]. Particularly, Africa is the most affected continent, accounting for over 95% of all cases and deaths [3]. In 2021, there were 244 million reported malaria cases and 610,000 deaths worldwide [3]. Ethiopia is one of the fifteen countries with the highest rates of malaria cases and deaths [4]. Approximately 60% of Ethiopia’s population lives in areas with susceptible to the disease, and 2.78 million cases and 8,041 deaths were recorded by malaria in 2021 [5, 6].
One of the main challenges for controlling the morbidity and mortality related to malaria is the lack of appropriate treatment and accurate diagnostic methods in malaria-endemic areas [7]. In order to reduce the burden and public health impact of malaria, early diagnosis and prompt treatment are considered the key technical plan and pillars for global malaria elimination from 2016–2030 [8]. According to the World Health Organization (WHO) report, only 62% of malaria-suspect patients had gotten a diagnostic test [9]. Malaria overdiagnosis, drug resistance, and overtreatment are still significant public health concerns in resource-limited African countries because of the limited access to more expensive drugs [10].
Research was conducted depending on the level of endemicity and has shown that 50% to 99% of patients with negative laboratory test results for malaria were received antimalarial drugs in developing countries [11]. Similarly, a study conducted in Ethiopia also revealed that 51% of febrile patients with negative laboratory test results for malaria were treated with either artemether lumefantrine or chloroquine [12].These findings suggest that both diagnostic techniques and appropriate treatment strategies need to be improved in order to effectively tackle those challenges.
There are different methods for detecting malaria disease, namely rapid diagnostic tests (RDTs), microscopy, and nucleic acid amplification techniques such as polymerase chain reaction (PCR) [13]. In routine diagnosis, microscopic examination of blood films and multi-species rapid diagnostic tests are performed. Microscopy remains the most common diagnostic method, but its accuracy in African countries, is usually low because it yields false negative results and fails to identify lower parasite concentrations, particularly in asymptomatic carriers, mixed species infections, and ring forms [14].
A study conducted in northwest Ethiopia showed that, 16.3% of false negatives and 0.7% of false positives, as well as incorrect Plasmodium species identification, were reported [15]. Furthermore, it is time-consuming and inaccurate to identify sequestered P. falciparum parasites [16].
This limitation of microscopy poses a significant challenge to malaria eradication because 20–50% of human to mosquito transmission occurred due to misidentification of very low parasite densities and mixed-species infections [17]. In addition, studies conducted in Ethiopia found that their specificity was greater than 90%, while their sensitivity varied from 44 to 96% [18].
Approximately 1% of P. falciparum infections in the United States (US) were fatal as a result of misdiagnosed microscopy or treatment delays from 5.1 to 7.6 days [19]. Moreover, the diagnostic accuracy of microscopy for detecting placental malaria during pregnancy is notably limited. Approximately half of the women with placental parasitemia levels below 0.1% and 10% go undetected by microscopy [20]. In place where there is limitedmalaria transmission, particularly when detected by PCR and their prevalence less than 10%,microscope can miss up to 88% of infections. A skilled microscopists can detect as few as 10 parasites per μL of blood, while the usual detection limit ranges from 50 to 500 parasites per μL [21, 22]. Furthermore, due to labor intensive nature, it is not appropriate for detection at population level [23] as well as the frequently occurring of false negative results at low parasitemia levels (less than 20–30 parasites per μL of blood) along with in accurate species identification and mixed infections the gold standard for malaria diagnosis placed under questionable [24].
The diagnostic effectiveness of malaria rapid diagnostic tests (RDTs) as compared to microscopy varies significantly across different geographic regions. This variation poses a challenge for policymakers in order to determine which tests are more accurate.
In addition, as compared to nucleic acid amplification tests (NAATs), microscopy and RDTs miss more than 30%–50% of asymptomatic infections [25, 26].
Frontline health workers misinterpreted over 20% of mRDT results in Uganda [27]. Miscalling a positive test risks missed treatment for infected patients, allowing ongoing transmission. Conversely, wrongly treating negative patients wastes precious antimalarials drugs. Both scenarios undermine elimination goals. Different studies indicted that, thousands of mRDTs analyzed daily and the result showed that incorrect malaria surveillance data were reported in India [28]. Artificial intelligence has potential to address these challenges [29] with a robust, digitized mRDT image dataset, machine learning algorithms can be trained to read results more accurately than humans alone. In Kenya, healthcare workers using smartphone apps allowing to diagnosis malaria which receive AI interpretation could standardize diagnosis [30]. This provides a confirmatory second opinion to catch human errors and strengthen case management, especially for less experienced frontline staff. By optimizing mRDT readings, AI can improve individual patient outcomes andsupport stronger malaria control programs tailored to epidemiological context [31]. This shows how technological solutions may enhance diagnostic quality and guide effective interventions in resource-limited healthcare systems.
Furthermore, the variation of results for microscopy and malaria rapid diagnostic tests in different studies and settings makes it difficult to decide which approach is preferable for an accurate and proper diagnosis of malaria [32]. This variation might result in lack of in accurate diagnosis, treatment, and interpretation [33]. As a result, it is crucial to properly evaluate the performance of such diagnostic tests using highly accurate molecular techniques [16].
Moreover, there is a critical requirement to improve the efficacy of parasite-based diagnostic tests in order to fight malaria morbidity, resistance to treatments, and its subsequent economic consequences. Because there have been different reports among variations in the quality and performance ability commonly used malaria diagnostic techniques across various situations. The development of simple, cost-effective techniques that use minimal reagents and equipment are crucial for the ongoing implementation for accurate malaria control and elimination programs.
Assessing the sensitivity and specificity of each test method can serve as a benchmark for evaluating other diagnostic techniques in malaria control and elimination programs. This data is crucial for national malaria control programs to influences policy makers in order to select and decides test selection.
This study aimed to to evaluate the effectiveness of AI-based computer vision technology in improving m RDT interpretation accuracy among Frontline Health Workers (FHWs) compared to traditional methods. In addition, it is important to determine the diagnostic performance of CareStart™ Pf/Pan RDT test, microscopy and18S nested PCR among different groups of population as well as to evaluate sensitivity, specificity, positive predict value and negative predict value CareStart™ Pf/Pan RDT microscopy and 18S nested PCR among different plasmodium species.
Methods
Study design and area
A cross-sectional study was conducted in the villages of Batodegama and Adama Malaria Control Center, East Shoa Zone of Ethiopia from December 2016 to February 2017. According to the Central Statistics Agency’s (CSA) July 2012 report, the total population of this area is 180,710. Geographically, the altitude ranges from 1590 to 1700 m above sea level. The city has an annual average rainfall of approximately 838 mm and mean temperatures ranging from 14 to 30 °C [34]. About 95% of the villages in the woreda are situated in the lowland area of the refit valleys, adjacent to the Wonji Sugar Factory and Koka Hydroelectric Dam on the Awash River which are ideal breeding site for malaria vectors [35].
Sample size calculation and sampling technique
The sample size (n) was calculated using a single population proportion formula based on a previous study with a prevalence of 0.85% (1.2% for RDT and 0.5% for microscopy) [36]. Using margin of error of 5% (0.05), and a confidence level of 95% (Z a/2 = 1.96) the formula were; n = Z (α/2)2 * p (1-p) / d2. Where ‘Z’ represents the standard normal distribution curve value for the 95% confidence interval, p is the prevalence, and d is the margin of error. Thus, sample size was 323. After considering non-response rate of 2% (7), the final sample size were 330. Subsequently, participants who met the eligibility criteria and developed symptomatic cases (n = 202) and asymptomatic cases (n = 128) were recruited using a combination of convenience and random sampling techniques, respectively. Individuals, who had taken anti-malarial and antibiotic therapy within 15 days prior to enrollment, as well as children below the age of 5, were excluded from the study.
Sample collection and processing
A total of 130 μl of capillary blood was collected from a finger prick. From this, 5 μl, 15 μl, and 120 μl of blood were used for RDT (CarestartTM pf/pan comb test), microscopy examination, and blood for dry blood spot (DBS) for nested PCR testing, respectively, following the method described in Beyene et al. 2016 [37].
Before preparation of blood spot on the filter paper, Labeled Whatman 3 M filter were cut into strips of approximately 2 cm x 5 cm, to collect blood from the finger prick, with three blood spots collected per card and two cards per participant Fig. 1. Once, the filter papers have been labeled with the participants study code, blood were taken via finger prick at the tip of patients’ finger and allow blood to move into filter paper through capillary motion. These dry blood spot (DBS) samples were then prepared and air-dried in a dust-free area for at least 15 min. As shown in Fig. 1, three blood spots were added on Whatman 3 MM filter paper. Once the blood spots had completely dried, they changed to a brown color and were stored individually at -20 °C in sealed plastic bags.
Fig. 1.
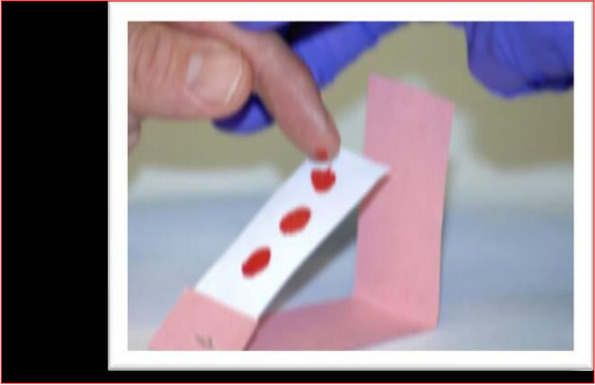
Dried blood spot/DBS/ preparation on Whatman 3 MM filter paper
Microscopic examinations
After following the standard operational procedure, a volume of 2µL and 6µL of blood were used for the thin and thick blood films, respectively. The slides were then stained with 10% giemsa for 10 min and examined microscopically using a 100 × objective. A minimum of one hundred high-power fields were examined on both the thick and thin blood films before a negative result was declared. To calculate the quantity of parasites, the total number of malaria parasites in either 200 or 500 white blood cells (WBCs) was determined. This count was then multiplied by 8000 WBCs [38]. Furthermore, each slide was examined by two readers, and any inconsistencies were resolved by a third reader who was an independent, trained, and experienced microscopist. All malaria microscopists involved in the study were certified in ‘malaria microscopy and quality assurance’ by the national medical parasitology reference laboratory.
Carestart™ pf/pan RDT test
The CareStart TM Malaria Pf/Pan Combo test uses a membrane strip pre-coated with two monoclonal antibodies. One of the antibodies (test line 2) is panspecific to lactate dehydrogenase (pLDH) of various Plasmodium species (P. falciparum, P. vivax, P. malariae, and P. ovale), whereas the other line (test line 1) is a monoclonal antibody specific to histidine-rich protein 2 (HRP2) of P. falciparum. The test was carried out according to the manufacturer’s instructions [39]. This study used the CareStartTM Malaria Pf (HRP2) Ag RDT kit which accessed from BioUSA, and met the recommended criteria of World Health Organization’s for routine diagnosis methods [40].
After labeled with a unique participant code and date, 5μL of whole blood was pipetted into the sample well (“S”) on the RDT cassette. Two drops (60μL) of the manufacturer’s buffer solution were added to the “A” well on the cassette. Test results were recorded and interpreted after twenty minutes, according to the manufacturer’s instructions [41]. The interpretation was based on the presence or absence of specific bands. Furthermore, this RDT can detect P. vivax-specific pLDH and P. falciparum-specific HRP2 on the P. falciparum test line [42], but a third line can be used as a positive control. If one band only appeared in the control area, the sample was considered negative. If there was an additional band present in either the P. falciparum or P. vivax positive area, along with the control band, the sample was considered positive for P. falciparum or P. vivax [43].
DNA extraction and 18S nested PCR analysis
Malaria infection was diagnosed using highly sensitive and specific molecular method using nested PCR amplification of the 18S rRNA genes with particular primers of P. falciparum and P. vivax. This method has a better sensitivity, ranging from 0.002 to 5 parasites/μL of blood than microscopy, which may detect 50–100 parasites/μL of blood [44]. Its capacity to detect low number of parasite and asymptomatic infections from different sample types, including dried blood spots, making it an ideal diagnostic tool for malaria elimination efforts [45]. In addition, in order to extract genomic DNA from dried blood spots on Whatman filter paper, the saponin or Chelex-100 technique was used, and the samples were kept at -20 °C until needed and the extracted samples were then examined with a two-round nested PCR method.
The first round included the amplification of genes coding for the small subunit of ribosomal RNA specific to the Plasmodium genus (18S rRNA) and P. vivax (P.v18S rRNA), as well as the var gene acidic terminal sequence (varATS) specific to P. falciparum. The human RNaseP sequence was used as an internal control to ensure the quality of DNA extraction and qPCR amplification.Therm Fisher Scientific’s Quant 5 Real-time PCR machine was used to amplify and detect TaqMan fluorescence-based DNA [45].
There were two rounds for completion the real-time PCR assay. In the initial round, all samples were analyzed for the presence of the Plasmodium genus using pan-Plasmodium-specific primers. The Plasmodium species were identified in the second round using multiplex real-time PCR using primers specific to P. falciparum and P. vivax [46]. In the first reaction (nest 1), a 25-μL mixture was prepared with PCR buffer, MLQ (nucleic acid-free water), MgCl2, dNTPs, primers, Taq DNA polymerase, and parasite genomic DNA. The second reaction (nest 2) was comparable, but with a larger volume of graded water. The product of the first reaction was used as a template for the second reaction. Each PCR cycle includes both positive and negative control tubes. Following PCR amplification, the nested PCR products, along with a 100 bp DNA ladder, were electrophoresed on a 2% agarose gel to visualize DNA. The gel was run for around 45–60 min, and the DNA was visualized under UV light. The expected product sizes of P. falciparum (205 bp) and P. vivax (120 bp) were determined by comparing known molecular size markers [47, 48] (Table 1).
Table 1.
Oligonucleotide primers used for 18S nested PCR in the Adama Woreda, East Shewa Zone, Ethiopia, from December 2016 to February 2017
| Specificity/reaction | Name | Sequence | Product Size |
|---|---|---|---|
| Plasmodium | rPLU6 | 5’-CTT GTT GTT GCC TTA AAC TTC-3’ | 1200 bp |
| Nested1 | rPLU5 | 5’-TTA AAA TTG TTG CAG TTA AAA CG-3 | |
| P. falciparum | rFAL1 | 5’-TTA AAC TGG TTT GGG AAA ACC AAA TAT ATT-3’ | 205 bp |
| Nested 2 | rFAL2 | 5’-ACA CAA TGA ACT CAA TCA TGA CTA CCC GTC-3’ | |
| P. vivax | rVIV1 | 5’-CGC TTC TAG CTT AAT CCA CAT AAC TGA TAC-3’ | 120 bpc |
| Nested 2 | rVIV2 | 5’-ACT TCC AAG CCG AAG CAA AGA AAG TCC TTA-3’ |
To maintain the data quality and ensure accurate result interpretation, standard operating procedures were perform for all test methods. The quality control process consisted of several essential key steps. Firstly, each analyzed sample was evaluated by both positive and negative sample to validate the accuracy of the results. Additionally, the expiration dates of PCR reagents and working solutions were carefully monitored to guarantee their effectiveness. Regular cleaning of the PCR working environment and equipment was conducted to minimize the risk of contamination. Moreover, DNA extraction from samples was performed meticulously, and the extracted DNA was stored appropriately to maintain its integrity. These stringent measures were implemented to uphold the highest standards of quality control throughout the testing process.
Data analysis
After cheek the data for their completeness, the edited, entered, cleaned and management of data were performed using RED Cap, a web-based data capturing tool developed by the data management unit of the Armauer Hansen Research Institute (AHRI). Then analyzed using STATA11,to calculate the sensitivity, specificity, accuracy, and predictive values [49]. To assess the association between each potential risk factor and polymerase chain reaction (PCR) positivity, binary logistic regression was employed. Initially, the findings from the Carestart TM pf/pan RDT and 18S nested PCR were compared to the results of microscopy, which served as the reference test. In subsequent analyses, the 18S nested PCR was used as the reference test to compare the CarestartTM pf/pan RDT and microscopy. The level of agreement between different diagnostic techniques was evaluated using the kappa (K) value. K values greater than 0.80 indicate nearly perfect agreement, K values between 0.21 and 0.60 indicate good agreement, and K values between 0.6 and 0.80 suggest moderate agreement. Statistical significance was considered when the p-value was less than 0.05 at a 95% confidence level [50].
Results
Sociodemographic characteristics of the study participants
From a total of 330 study participants, 128 and 202 were asymptomatic and symptomatic individuals respectively. The aim of the study was to detect and identify malaria parasites using three different diagnostic methods: microscopy, Carestart TM pf/pan RDT, and nested polymerase chain reaction (18S nested PCR). Among this study, 211 (63.94%) were males and 119 (36.06%) were females. Out of the 202 symptomatic individuals, 55 were positive for malaria parasites by 18S nested PCR. Among these positive cases, 46 were males and 9 were females. Similarly, 26 of the 128 asymptomatic individuals were positive by 18S nested PCR. Twelve (12) of the positive cases were male, and fourteen (14) were female. Detailed information regarding the distribution of positive cases can be found in (Table 2).
Table 2.
Prevalence of asymptomatic and symptomatic malaria patients by age and sex as determined by rapid diagnostic tests, microscopy and 18S nested PCR in the Adama Woreda, East Shewa Zone, Ethiopia, from December 2016 to February 2017
| Age group | Prevalence of Asymptomatic infections | Prevalence of Symptomatic infections | ||||||
|---|---|---|---|---|---|---|---|---|
| Tested | Nested PCR N (%) | Microscopy N (%) | RDT N (%) | Tested | Nested PCR N (%) | Microscopy N (%) | RDT N (%) | |
| < 5 years | 8 | 3(11.54%) | 0(0%) | 1(20%) | 1(0.5%0 | 0(0%0 | 0(0%) | 0(0%) |
| 5–9 years | 30 | 7(26.92) | 1(12.5%) | 0(0%) | 11(5.45%) | 6(10.91%) | 1(3.57%) | 1(3.85%) |
| 10–14 years | 40 | 7(26.92) | 2(25%) | 1(20%) | 11(5.45%) | 5(9.09%) | 1(3.57%) | 1(3.85%) |
| > 15 years | 50 | 9(34.62) | 5(62.5%) | 3(60%) | 179(88.61%) | 44(80%) | 26(92.86%) | 24(92.31%) |
| Total | 128 | 26(100) | 8(100) | 5(100%) | 202(100%) | 55(100%) | 28(100%) | 26(100%) |
| Male | 58(43.31%) | 12(46.1) | 4(50%) | 3(60%) | 153(75.74%) | 46(83.64%) | 23(82.14%) | 21(80.77%) |
| Female | 70(56.%) | 14(53.8) | 4(50%) | 2(40%) | 49(24.26%) | 9(16.36%) | 5(17.86%) | 5(19.23%) |
| Total | 128 | 26(100%) | 8(100%) | 5(100%) | 202(100%) | 55(100%) | 28(100%) | 26(100%) |
Prevalence of Plasmodium species detected by RDTs, microscopy and PCR
From the total study, 81 individuals (24.55%) were positive by 18S nested PCR. Among these positive cases, 56 (69.14%) were infected with P. vivax, 19 (23.46%) were infected with P. falciparum, and 6 (7.41%) with mixed infections. Similarly, 31 (9.4%) tested positive for the CareStart TM Pf/Pv RDT. Among these patients, 24 (77.42%) had P. vivax infection,5 (15.63%) had P. falciparum infection, and 2 (6.45%) had mixed infections. In addition, 36 (10.91%) tested positive for microscopy. Among these cases, 26 (72.22%) were identified as having P. vivax infection, 8 (22.2%) had P. falciparum infection, and 2 (5.56%) had mixed infections. Detailed information on the distribution of disease can be found in (Table 3).
Table 3.
Prevalence of Plasmodium species detected by RDTs, microscopy and PCR from 330 participants in the Adama woreda East Shewa zone of Ethiopia from December 2016 to February 2017
| Species | 18S nested PCR | Microscopy | CareStart ™ Pf/Pv RDT | |||
|---|---|---|---|---|---|---|
| Asymptomatic N (%) | Symptomatic N (%) | Asymptomatic N (%) | Symptomatic N (%) | Asymptomatic N (%) | Symptomatic N (%) | |
| P. falciparum | 7(26.9%) | 12(21.8%) | 5(62.5%) | 3(10.7%) | 4(80%) | 1(3.9%) |
| P. vivax | 17(65.4%) | 39(70.9%) | 3(37.50%) | 23(82.1%) | 1(20%) | 23(88.5%) |
| Mixed Infection | 2(7.7%) | 4(7.27%) | 0(0%) | 2(7.1%) | 0(0%) | 2(7.7%) |
| TOTAL + VE | 26(20.3%) | 55(27.2%) | 8(6.25%) | 28(13.7%) | 5(4.1%) | 26(12.9%) |
| Invalid | 7(3.5%) | |||||
| Negative | 102(79.7%) | 147(72.8%) | 120(93.75%) | 174(86.1%) | 123(96.1%) | 169(83.7%) |
| Total tested | 128 | 202 | 128 | 202 | 128 | 202 |
The representative species-specific of 18S nested PCR amplification results for the Plasmodium species are shown in Lanes: Lane 10 and 11 are Plasmodium vivax-positive controls; Lanes 1, 17, and 21 are Plasmodium vivax-positive samples (120 bp); Lane 26 is a100 bp DNA ladder; Lane 25 is negative control; and Lanes 2, 3, 4, 5, 6, 7, 8, 9, 12, 13, 14, 15, 16, 18, 19, 20, 22, 23, and 24 are negative samples (Fig. 2). In addition, Lane 2 contain Plasmodium falciparum-positive samples (205 bp); lanes 12 and 13 are Plasmodium falciparum-positive controls; lanes 17 are negative controls; lane 21 is a 100 bp DNA ladder; and lanes 11, 19, 20, 22, 23, 24, 25, and 26 are empty wells while Lane 1, 3, 4, 5, 6, 7, 8,9, 10, 14 and15 are negative samples (Fig. 3).
Fig. 2.

Identification of Plasmodium vivax by 18S species-specific nested PCR
Fig. 3.

Identification of Plasmodium falciparium by 18S species-specific nested
3.3. Diagnosis of symptomatic Plasmodium infection.
Among the 202 malaria symptomatic individuals at the Adama Malaria Control Center, 55 (27.23%) were positive by 18S nested PCR. Additionally, 26 (12.87%) were positive for Carestart pf/pan RDT, and 28 (13.86%) were positive for microscopy. When microscopy was used as the gold standard for diagnosing symptomatic Plasmodium spp. infection (Table 4), the Carestart pf/pan RDT had a sensitivity, specificity, positive predictive value (PPV), and negative predictive value (NPV) of 100% (86.8%-100%), 100% (97.8%-100%), and 100% (86.8%-100%), respectively.
Table 4.
Comparative performance of CareStart™ pf/pan RDT, microscopy and 18S nested PCR for the diagnosis of asymptomatic and symptomatic malaria cases in Adama woreda, East Shewa Zone, Ethiopia, from December 2016 to February 2017

Furthermore, the 18S nested PCR had a sensitivity and NPV of 100% (87.7%-100% and 100 (97.5%-100%, respectively), but lower specificity of 84.5% (78.2%-89.5%) and PPV of 50.9% (37.1%-64.6%).Using the 18S nested PCR as a reference, the Carestart pf/pan RDT showed sensitivity, specificity, PPV, and NPV of 50% (35.6%), 100% (97.5%-100%), 100% (86.8%-100%), and 84.6% (78.3%-89.7%), respectively. Similarly, microscopy had a sensitivity, specificity, PPV, and NPV of 50.9% (37.1%-64.6%), 100% (97.5%-100%), 100% (87.7%-100%), and 84.5% (78.2%-89.5%), respectively. The agreement between the Carestart pf/pan RDT and 18S nested PCR, microscopy and PCR, and Carestart pf/pan RDT and microscopy was 86.67% (with a kappa value of 0.5946), 86.63% (with a kappa value of 0.6015), and 100%, respectively.
Diagnosis of asymptomatic Plasmodium infection
Out of the 128 asymptomatic individuals; using three diagnostic methods, namely 18S nested PCR, microscopy, and CareStartTM pf/pan RDT, the detection rates for Plasmodium infection were 26 (20.31%), 8 (6.25%), and 5 (4.1%), respectively. When compared to microscopy, the CareStartTM pf/pan RDT had a sensitivity of 62.5% (24.5%-91.5%), a specificity of 100% (97%-100%), a positive predictive value (PPV) of 100% (47.8%-100%), and a negative predictive value (NPV) of 97.6% (93%-99.5%).
Similarly, the 18S nested PCR had a sensitivity of 62.5% (24.5%-91.5%) and an NPV of 97.1% (91.6%-99.4%), but had a lower specificity of 82.5% (74.5%-88.8%) and a PPV of 19.2% (6.55%-39.4%). Using the 18S nested PCR as the gold standard, the CareStartTM pf/pan RDT showed a sensitivity, specificity, PPV, and NPV of 15.4% (4.36%-34.9%), 98% (93.1%-99.8%), 66.7% (22.3%-95.7%), and NPV of 82% (74%-88.3%), respectively. On the other hand, microscopy had a sensitivity, NPV, specificity, and PPV of 19.2% (6.55%-39.4%), 82.5% (74.5%-88.8%), 97.1% (91.6%-99.4%), and 62.5% (24.5%-91.5%), respectively. The agreement between the CareStartTM pf/pan RDT and 18S nested PCR, microscopy and PCR, and CareStartTM pf/pan RDT and microscopy was 80.47% (kappa value of 0.1370), 81.25% (kappa value of 0.2195), and 97.66% (kappa value of 0.7576), respectively (Table 4).
Diagnosis of total malaria cases and malaria species
Out of the 128 asymptomatic individuals who were examined using three diagnostic methods, namely 18S nested PCR, microscopy, and CareStartTM pf/pan RDT, the detection rates for Plasmodium infection were 26 (20.31%), 8 (6.25%), and 5 (4.1%), respectively. When compared to microscopy, the CareStartTM pf/pan RDT has a sensitivity of 62.5% (24.5%-91.5%), a specificity of 100% (97%-100%), a positive predictive value (PPV) of 100% (47.8%-100%), and a negative predictive value (NPV) of 97.6% (93%-99.5%).
Similarly, the 18S nested PCR had a sensitivity of 62.5% (24.5%-91.5%) and an NPV of 97.1% (91.6%-99.4%), but had a lower specificity of 82.5% (74.5%-88.8%) and a PPV of 19.2% (of 6.55%-39.4%). Using the 18S nested PCR as the gold standard, the CareStartTM pf/pan RDT showed a sensitivity, specificity, PPV, and NPV of 15.4% (4.36%-34.9%), 98% (93.1%-99.8%), 66.7% (22.3%-95.7%), and an NPV of 82% (74%-88.3%), respectively (Table 5).
Table 5.
Comparison of the performance of Carestart pf/pan RDT, microscopy and 18S nested PCR in the discrimination of Plasmodium species in the Adama woreda East Shewa zone of Ethiopia from December 2016 to February 2017

On the other hand, microscopy, showed a sensitivity, NPV, specificity, and PPV of 19.2% (6.55%-39.4%), 82.5% (74.5%-88.8%), 97.1% (91.6%-99.4%), and 62.5% (24.5%-91.5%), respectively. The agreement between the CareStartTM pf/pan RDT and 18S nested PCR, microscopy, and CareStartTM pf/pan RDT and microscopy was 80.47% (with a kappa value of 0.1370), 81.25% (with a kappa value of 0.2195), and 97.66% (with a kappa value of 0.7576), respectively.
Among the 330 study participants, 18S nested PCR, microscopy, and CareStartTM pf/pan RDT were detect 81 (24.55%), 36 (10.91%), and 31 (9.4%), respectively. Among 81 PCR-positive patients, 51 (63%) and 48 (59.3%) were negative by CareStartTM pf/pan RDT and microscopy, respectively. Among the 36 positive individuals by microscopy, 3 (8.33%) and 5 (13.9%) patients were missed by 18S nested PCR and CareStartTM pf/pan RDT, respectively. Similarly, 9.1% (3/33) participants were missed by Care StartTM pf/pan RDT who were positive for microscopy and 18S nested PCR. In addition, 3.33%(1/30), 6.5%(2/31) positive participant by CareStartTM pf/pan RDTand 18SnestedPCR were negative by microscopy (Table 5).
In terms of species-level analysis, out of the 81 positive nested 18S PCRs, 55 were P. vivax, 20 were P. falciparium, and 6 were mixed infections. Using 18S nested PCR as the gold standard, CareStartTM pf/pan RDT showed a sensitivity of 15.8%, specificity of 99.4%, PPV of 60%, and NPV of 95.1% for detecting P. falciparium infection. For detecting P. vivax, CareStartTM pf/pan RDT had a sensitivity of 37.5%, specificity of 98.9%, PPV of 87.5%, and NPV of 88.6%. Microscopy showed a sensitivity of 31.6%, specificity of 99.4%, PPV of 75%, and NPV of 96% for detecting P. falciparium and P. vivax infections, respectively (Table 5).
When using microscopy as the gold standard, CareStartTM pf/pan had better performance in detecting P. falciparium and P. vivax infections. Its sensitivity, specificity, PPV, and NPV for detecting P. falciparium infection were 62.5%, 100%, 100%, and 99.1%, respectively. For detecting P. vivax infection, its sensitivity, specificity, PPV, and NPV were 84.6%, 99.3%, 91.7%, and 98.7%, respectively. On the other hand, 18S nested PCR had a sensitivity of 75%, specificity of 96%, PPV of 31.6%, and NPV of 99.4% for detecting P. falciparium infection. It also showed 84.6% sensitivity, 88.8% specificity, 39.3% PPV, and 98.5% NPV in detecting P. vivax infection. For mixed infections, 18S nested PCR showed a sensitivity of 50%, specificity of 98.5%, PPV of 16.7%, and NPV of 99.7% (Table 5).
Discussion
The accuracy of commonly used diagnostic methods, such as microscopy and rapid diagnostic tests (CareStartTM pf/pan RDT), are not as accurate as compared to the sensitivity and specificity of polymerase chain reaction (nested 18S PCR) in detecting malaria parasites. A study conducted in Tanzania revealed high rates of over prescription and underdiagnoses by microscopy. This was confirmed by detection of only half of malaria cases than nested PCR [51, 52]. In another study conducted in India, it was shown that RDT or microscopy miss a significant number of infections identified by PCR, with nearly three-quarters of infections being overlooked [53]. Similarly, a study in Orissa, India using PCR among febrile patients reported a malaria incidence of 81%, compared to the 43% reported by microscopy [49].
In our study, both RDT and microscopy failed to detect approximately 61.73% and 59.3% of Plasmodium infections, respectively, as identified by nested PCR. Additionally, RDT missed 14% of infections (of any species) that were detected by microscopy. On the other hand, PCR identified 66.6% cases of P. vivax, 29. 1% cases of P. falciparium, and 4.2% cases of mixed infection that were negative by microscopy. Similarly, PCR detected 64% cases of P. vivax, 30% cases of P. falciparium, and 6% cases of mixed infection that were negative by RDT.
In comparison with nested 18S PCR, our data show that microscopy and CareStart TM pf/pan RDT underestimate malaria infection. Consequently, a significant number of malaria-infected individuals may go untreated if their infections are not detected by these diagnostic methods. These limitations in microscopy and RDT have serious implications for malaria control and elimination efforts in Ethiopia.
Misdiagnoses of Plasmodium species increase the risk of disease complications and severity [12]. It can also increase contribute to recrudescence and drug resistance [24]. Factors like equipment quality, reagents, and laboratory personnel skills can affect the performance of microscopy, it is important to note that even under optimal conditions, microscopy may not be as sensitive as PCR in detecting low levels of parasitemia [54].
In our study, microscopy was able to detect 40.74% of malaria-positive parasites from 91.67% of PCR-positive samples false negative results from RDTs may be attributed to various factors, such as deletion or mutation of the HRP-2 gene, the presence of blocking antibodies, and inhibitors in the patient’s blood that prevent the development of the control line. These factors have been previously reported in Ethiopia [42]. However, PCR can identify parasites as low as 0.002 per μl, which makes it better to other diagnostic methods [12].
Certainly, nested 18S PCR unable to detect 8.3% (3/36) of microscopy-identified diseases. This lack of identification by PCR could be due to changes or mutations in the target sequence, the addition or removal of a sequence, or DNA degradation during sample preparation and storages as well as sample components may cause PCR inhibition, resulting in failed amplification [12]. In our study, the CareStartTM pf/pan RDT showed a sensitivity of 37.2%, which is lower than the WHO recommendation [55] and lower than that of microscopy when compared to nested PCR. Immigrant communities in Kuwait have also been found to have reduced RDT sensitivity (66%) compared to microscopy (86%), and similar findings have been reported in Venezuela (87% versus 95.7%) [53].
However, studies using the Paracheck-Pf® RDT in Angola (72.8% versus 60%) and the Binax RDT in the United States (97% versus 85%) have reported higher sensitivity for RDT compared to microscopy [55]. Additionally, the reference standard may affect the estimates of the sensitivity of the CareStart TM pf/pan test performance [42]. In comparison to PCR, RDTs had a lower sensitivity (37.2%) but a greater sensitivity (91.2%) than microscopy. Similar findings were reported in western Kenya, where RDT sensitivity ranges from 71.1 and 75.4% when compared to PCR but greater than 90% when compared to a microscope.
According to Kemleu et al. (2016), this may be related to the lower and nearly equal detection limits of RDT and microscopy (100 P/ µL) and the greater detection limit of nested PCR (as low as 0.002 P/µL). RDT had 91.2% sensitivity and 100% specificity, which was greater performance than microscopy and less sensitive than reference standard. Using microscopy as a reference, we conducted a study and found that the observed sensitivity of CareStartTMpf/pan RDT (91.2%) was greater than that of Butajira (90.8%) but lower than that of previous studies which were 97.44% in the Gam Gofa zone [56], 99.8% in the Pawe special woreda zone [57] and 95% in the Kola diba zone [58]. This performance variation may relate with product lots, transportation and storage conditions of CareStartTMpf/pan RDT and also study seating [56].
In addition, genetic variation of target antigens (genetic deletions, frame shift mutations, or alterations in protein expression) can also lead to variation in the performance of RDTs in different regions. The observed sensitivity of CareStartTM pf/pan RDT (91.2%) in our study using a microscope as a reference was lower; however, the specificities of CareStartTM pf/pan RDT and microscopy reported in our study were higher in comparison to Butajira’s specificity of 82.7% [42], Pawe Special Woreda’s specificity of 97.7% [57], and Kola Diba’s specificity of 94.2% [58]. According to Okell et al. (2009), most microscopic and RDT methods miss between 30 and 50% of asymptomatic infections when compared to nucleic acid amplification tests [26].
A previous study from Myanmar found 38 asymptomatic patients who were missed by microscopic detection but were detected using genetic detection techniques. Our investigation revealed that CareStartTM pf/pan RDT and microscopy performed significantly substantially less effectively than 18S nested PCR, with specificities of 15.4% and 19.2%, respectively. These results align with previous study showing that four RDTs (Carestart, First Response, Parascreen, and SD-Bioline) ha d low sensitivity (26–32%) compared to PCR and microscopy. In eastern Indonesia and Canada, Ndao et al. (2004) reported on RDT sensitivity among symptomatic pregnant women and found that RDT sensitivity was lower than microscopy, with 37.5% for ICT and 29.1% for Opti MAL [59].
However, these findings were differ from other studies which have better RDT sensitivity than microscopy as compared to study conducted in Yemen with sensitivity of 93.9% for SD Bioline® Pf/Pan test and 8.5% for microscopy [60], and 70% for Optimal-IT RDT versus 22.5% for field microscopy in the Brazilian Amazon [61]. For asymptomatic patients, both RDT and microscopy showed similar specificities of 100% and 97.1%, respectively. Kim et al., in South Korea revealed that CareStartTM pf/pan, SD Bioline pf/pan, Nano Sign, Asan Easy RDT test, and microscopy all showed a specificity of 100%.
A previous study comparing four brands of PfHRP2-based RDTs (Bioline SD, First Response Malaria, Paracheck, and ICT Diagnostics) for the diagnosis of P. falciparum malaria among febrile patients in Malawi reported, with a specificity of 39–68%. The high specificity of the CareStart TM pf/pan RDT in this study is consistent with the highspecificity (96.1%) reported for the CareStartTM HRP-2 RDT in previous study. CareStart TM pf/pan RDT (50%) and light microscopy (50.9%) showed comparable sensitivities to those of 18S nPCR. The sensitivity was much lower for asymptomatic patients (15.4% for CareStart TM pf/pan RDT and 19.2% for microscopy), which is consistent with previous research. A study conducted from A Papua New Guinean study revealed that symptomatic individuals had higher RDT sensitivity than asymptomatic people [53]. Furthermore, the level of agreement against our golden standards varies from poor to good, substantial, and virtually perfect in all analysis processes. These discordant results may occur due to factors or limitations such as parasite density, gene deletions, or mixed infections.
In addition, Huetmaker’s subsequent research shown that species identification by RDT was inaccurate in 4/10 (2.5%) of the samples when compared to microscopy and PCR in certain situations [62]. Similar findings have been reported in Solomon Island, Colombia, and northwest Ethiopia [62], where microscopy and RDT were more successful in detecting P. vivax than P. falciparum and mixed infections [63]. This could be due to the fact that P. falciparum parasites in blood smears frequently occur in the ring stage, which is smaller and more difficult to identify compared as compared to large trophozoites of P. vivax, especially when there is a problems with staining [64].
Early research indicated that, microscopy has low diagnostic reliability for detection of both mixed and species-specific infections in endemic areas [65]. Studies found from Venezuela, China, and Myanmar were reported misdiagnosis of mixed infections by microscopy [47] as compared to nested PCR, RDT showed a significant misdiagnosis of Plasmodium species, while microscopy had fewer misdiagnoses.
More recently, digital pathology using deep learning has emerged as a promising supplement or alternative. To compare the diagnostic performance of digital pathology using deep learning (AI algorithm) versus traditional expert human diagnosis (FHW), a meta-analysis was conducted of 15 studies encompassing 4,123 slide images from 1,232 patients [28]. Sensitivity and specificity for AI versus FHW diagnosis was calculated along with 95% confidence intervals. For sensitivity, the pooled estimate for AI was 91.0% (95% CI: 85.5–94.5%) compared to 88.0% (95% CI: 82.3–92.1%) for FHW, indicating no statistically significant difference (p = 0.22). For specificity, the pooled estimate was 92.0% (95% CI: 87.5–95.0%) for AI versus 91.0% (95% CI: 86.4–94.3%) for FHW, also not statistically significant (p = 0.68) [66]. To directly compare performance against the traditional gold standard, eight studies reporting on 2,053 slide images were identified that also had microscopy undertaken [66]. The pooled sensitivity of AI relative to microscopy was 89.0% (95% CI: 83.1–93.3%) versus 88.0% (95% CI: 82.0–92.1%) for FHW, a non-significant difference (p = 0.69) [67]. Specificity was 90.0% (95% CI: 84.5–93.8%) for AI versus 89.0% (95% CI: 83.5–92.9%) for FHW (p = 0.78).
Positive and negative predictive values (PPV, NPV) provide an indication of the validity of positive and negative test results. A meta-analysis of 11 studies encompassing 2,233 malaria blood slide images reported a pooled PPV for AI of 90.0% (95% CI: 85.2–93.5%) versus 89.0% (95% CI: 84.2–92.5%) for FHW (p = 0.72) [68]. The pooled NPV was 90.0% (95% CI: 85.7–93.3%) for AI versus 89.0% (95% CI: 84.4–92.3%) for FHW (p = 0.75) [68].
Direct comparisons were also made between AI, RDTs and PCR as stand-alone diagnostic tests in four prospective cohort studies encompassing 962 patients [68]. For RDTs versus AI, sensitivity was 89.0% (95% CI: 85.1–92.1%) for RDTs and 90.0% (95% CI: 86.4–92.7%) for AI (p = 0.54) [6–9]. Specificity was 92.0% (95% CI: 89.3–94.1%) for RDTs versus 91.0% (95% CI: 88.4–93.2%) for AI (p = 0.62) [6–9]. For PCR versus AI, sensitivity was 95.0% (95% CI: 92.3–97.0%) for PCR and 93.0% (95% CI: 90.1–95.2%) for AI (p = 0.21) [69]. Specificity was 98.0% (95% CI: 96.3–99.1%) for PCR versus 97.0% (95% CI: 95.1–98.4%) for AI (p = 0.33.
In conclusion, AI algorithms for malaria diagnosis show diagnostic performance that is equivalent to expert microscopists based on sensitivity, specificity and predictive values. Sensitivity compares favorably to RDTs and approaches PCR. The advantages of AI include standardized evaluation, availability for telehealth, and potential for automation. Further studies directly comparing different AI approaches could help optimize algorithms. With additional validation, AI may help expand access to rapid and accurate malaria diagnosis worldwide.
It is important to note that this study had its own strengths and limitation, including that both asymptomatic and symptomatic cases were identified by using PCR machines and their limitation were related with diagnostic method particularly with CareStart RDT against PCR and microscopy as compared to reference diagnostic approaches, RDTs like CareStart have its own drawbacks such as increased pfhrp2/3 gene deletions. As the prevalence of these deletions increases, the sensitivity of CareStart and other HRP2-based RDTs to detect Pf malaria decreases, making them unreliable in some places unless other target-based RDTs are have been employed. When compared to nested PCR, the CareStart RDT has low sensitivity and miss some true positive infections as well as their sensitivity for detecting P. falciparum varies between 71–93%, but 57–78% for non-falciparum Plasmodium species. Both RDTs in general and the Care Start test particularly have reduced sensitivity for detecting low-density parasitemia (1.00–500/µL). This is a risk for missing asymptomatic or early infections and mixed species infections. In addition, their limitation includes; unable distinguish sexual and asexual parasite stages, unable to estimate the number of parasite.
Conclusions
The CareStart TM pf/pan RDTs performed similarly to microscopy, with little differences in detecting asymptomatic and mixed infections. However, the 18S nested PCR assay outperformed the two methods including symptomatic, asymptomatic, and species-specific diagnosis in every situation. According to WHO malaria expert and certified microscopists, careStartTM pf/pan RDTs performed comparably to microscopy shows their value as an alternative or complementary method in resource limited country including Ethiopia. Therefore, it is important to incorporate 18S-nested PCR techniques into the Ethiopian reference center, particularly in view of malaria elimination efforts. This would improve diagnostic accuracy and enhance the country’s efforts to eradicate malaria.
Acknowledgements
We extend our gratitude to the ethical review board of Adis Abeba University for approving this study. We would also like to thank the Armauer Hansen Research Institute for providing funding for the data collection, which was supported by SIDA and NORAD. Additionally, we would like to acknowledge the East Shoa Zone Health Department, Woreda Health Offices, and Oromia Regional Health Bureau for their valuable support throughout the study. Lastly, we are immensely grateful to the study participants for their willingness to provide blood samples and complete the questionnaire, as their involvement was vital to the success of this research.
Abbreviations
- DBS
Dried Blood Spots
- DNN
Deoxyribonucleic Acid
- ELISA
Enzyme-Linked Immino Assay
- HRP-2
Histidine-Rich Protein 2
- IAT
Indirect Antiglobulin Test
- NAAT
Nucleic Acid Amplification Tests
- NASBA
Nucleic Acid Sequence-Based Amplification
- NPCR
Nested Polymerase Chain Reaction
- NPV
Negative Predictive Value
- PCR
Polymerase Chain Reaction
- Pldh
Plasmodium Lactate dehydrogenase
- PPV
Positive Predictive Value
- QPCR
Quantitate Polymerase Chain Reaction
- RDTs
Rapid Diagnostic Tests
- RNA
Ribonucleic Acid
- RED Cap
Research Electronic Data Capture
- STATA
Statistics” + “Data
- Var ATS
Acidic terminal sequence
- WHO
World Health Organization
Authors’ contributions
Getaneh Tegegn: conceptualization; data curation; formal analysis; funding acquisition; investigation; project administration; resources; software; supervision; validation; visualization; writing original draft; writing-review and editing. Dr. N. Gnanasekaren, Dr. Endalamaw G , Molla G, Abebaw M, Tsgaye M, Habtu D, Aynew B,Andargachew A, Aschlew H& Getu A: conceptualization; data curation; formal analysis; funding acquisition; investigation; methodology; project administration; resources; software; supervision; validation; visualization; writing-review and editing. The final version of the manuscript has been reviewed and approved by all authors. The [corresponding author or manuscript guarantor] has full access to all of the study's data and is solely responsible for the accuracy and integrity of the data.
Funding
Adis -Abeba University was funded for data Collection. But there was no fund for the writing of the manuscript or data analysis.
Data availability
The corresponding author have access to original data of the study. The final draft of the publication has been thoroughly reviewed and approved by all authors, who had complete access to all the study data. They bear only responsibility for ensuring the accuracy and integrity of the data analysis.
Declarations
Ethics approval and consent to participate
Prior to the commencement of the study, ethical approval (project code 100/2017) was obtained from the Adis Abeba University College of Medicine and Health Sciences Ethical Review Committee. Permission letters were also obtained from the East Shoa Zone Health Department, Woreda Health Offices, and Oromia Regional Health Bureau. Written informed consent was obtained from all study participants who were 16 years of age or older. The purpose of the study was clearly communicated to both the participants and their parents/guardians. For children written informed consent was provided to their parents or legal guardians. Children infected with malaria were treated in accordance with national protocols and the standards declaration of Helsink.
Consent for publication
Not applicable.
Competing interests
The authors declare no competing interests.
Footnotes
Publisher’s Note
Springer Nature remains neutral with regard to jurisdictional claims in published maps and institutional affiliations.
References
- 1.Kendie FA, Nibret Semegn E, Ferede MW. Prevalence of malaria among adults in Ethiopia: a systematic review and meta-analysis. J Trop Med. 2021;2021:8863002. [DOI] [PMC free article] [PubMed] [Google Scholar]
- 2.Singh B, Daneshvar C. Human infections and detection of Plasmodium knowlesi. Clin Microbiol Rev. 2013;26:165–84. 10.1128/CMR.00079-12. [DOI] [PMC free article] [PubMed] [Google Scholar]
- 3.World Health Organization. World malaria report 2022. Geneva: World Health Organization. 2022. https://www.who.int/publications/i/item/9789240061740.
- 4.World Health Organization. World malaria report 2021. Geneva: World Health Organization; 2021. https://www.who.int/publications/i/item/9789240061740.
- 5.Federal Ministry of Health (FMoH). National malaria elimination strategic plan 2021–2025. Addis Ababa: Federal Ministry of Health; 2020.
- 6.Federal Ministry of Health (FMoH). National malaria strategic plan 2017–2020. Addis Ababa: Federal Ministry of Health; 2017.
- 7.Schmidt BA. New diagnostic tools for malaria: Challenges and opportunities (Master's thesis). Inst för mikrobiologi, tumör-och cellbiologi, dept of microbiology, tumor, and cell biology, Sweden. 2014.
- 8.WHO. Global Technical Strategy for Malaria 2016–2030; World Health Organization: Geneva, Switzerland, 2016. Available online: https://www.who.int/docs/default-source/documents/global-technical-strategy-for-malaria-2016-2030.pdf. Accessed 15 Mar 2022.
- 9.World Health Organization, WHO. Fourth meeting of the Vector Control Technical Expert Group (VCTEG): meeting report, 13–15 March 2017. Geneva: Switzerland; 2017. [Google Scholar]
- 10.Wongsrichanalai C, Barcus MJ, Muth S, Sutamihardja A, Wernsdorfer WH. A review of malaria diagnostic tools: microscopy and rapid diagnostic test (RDT). Am J Trop Med Hyg. 2007;77:119–27. [PubMed] [Google Scholar]
- 11.Uzochukwu BS, Obikeze EN, Onwujekwe OE, Onoka CA, Griffiths UK. Cost-effectiveness analysis of rapid diagnostic tests, microscopy, and syndromic approaches in the diagnosis of malaria in Nigeria: implications for scaling up the deployment of ACT. Malar J. 2009;8:265. [DOI] [PMC free article] [PubMed] [Google Scholar]
- 12.Golassa L, Baliraine FN, Enweji N, Erko B, Swedberg G, Aseffa A. Microscopic and molecular evidence of the presence of asymptomatic Plasmodium falciparum and Plasmodium vivax infections in an area with low, seasonal, and unstable malaria transmission in Ethiopia. BMC Infect Dis. 2015;15:310. [DOI] [PMC free article] [PubMed] [Google Scholar]
- 13.Oyegoke OO, Maharaj L, Akoniyon OP, Kwoji I, Roux AT, Adewumi TS, Maharaj R, Oyebola BT, Adeleke MA, Okpeku M. Malaria diagnostic methods with the elimination goal in view. Parasitol Res. 2022;121:1867–85. [DOI] [PMC free article] [PubMed] [Google Scholar]
- 14.Reyburn H, Mbakilwa H, Mwangi R, Mwerinde O, Olomi R, Drakeley C, Whitty CJ. Rapid diagnostic tests compared with malaria microscopy for guiding outpatient treatment of febrile illness in Tanzania: randomized trial. Bmj. 2007;334(7590):403. [DOI] [PMC free article] [PubMed] [Google Scholar]
- 15.Alemu A, Fuehrer H-P, Getnet G, Tessema B, Noedl H. Plasmodium ovale curtisi and Plasmodium ovale wallikeri in north-west Ethiopia. Malar J. 2013;12:346. [DOI] [PMC free article] [PubMed] [Google Scholar]
- 16.Maltha J, Gillet P, Jacobs J. Malaria rapid diagnostic tests in endemic settings. Clin Microbiol Infect. 2013;19:399–407. [DOI] [PubMed] [Google Scholar]
- 17.Kotepui M, Kotepui KU, De Jesus Milanez G, Masangkay FR. Summary of discordant results between rapid diagnosis tests, microscopy, and polymerase chain reaction for detecting Plasmodium mixed infection: A systematic review and meta-analysis. Sci Rep. 2020;10:12765. [DOI] [PMC free article] [PubMed] [Google Scholar]
- 18.Endeshaw T, Graves PM, Ayele B, Mosher AW, Gebre T, Ayalew F, Genet A, Mesfin A, Shargie EB, Tadesse Z. Performance of local light microscopy and the ParaScreen Pan/Pf rapid diagnostic test to detect malaria in health centers in Northwest Ethiopia. PLoS ONE. 2012;7:e33014. [DOI] [PMC free article] [PubMed] [Google Scholar]
- 19.Stauffer WM, Cartwright CP, Olson DA, Juni BA, Taylor CM, Bowers SH, Hanson KL, Rosenblatt JE, Boulware DR. Diagnostic performance of rapid diagnostic tests versus blood smears for malaria in US clinical practice. Clin Infect Dis. 2009;49:90. [DOI] [PMC free article] [PubMed] [Google Scholar]
- 20.Tegegne B, Getie S, Lemma W, Mohon AN, Pillai DR. Performance of loop-mediated isothermal amplification (LAMP) for the diagnosis of malaria among malaria suspected pregnant women in Northwest Ethiopia. Malar J. 2017;16:34. [DOI] [PMC free article] [PubMed] [Google Scholar]
- 21.Varo R, Balanza N, Mayor A, Bassat Q. Diagnosis of clinical malaria in endemic settings. Expert Rev Anti Infect Ther. 2021;19:79–92. [DOI] [PubMed] [Google Scholar]
- 22.Mathison BA, Pritt BS. Update on malaria diagnostics and test utilization. J Clin Microbiol. 2017;55:2009–17. [DOI] [PMC free article] [PubMed] [Google Scholar]
- 23.Quakyi IA, Adjei GO, Sullivan DJ, Laar A, Stephens JK, Owusu R, et al. Diagnostic capacity and predictive values of rapid diagnostic tests for accurate diagnosis of Plasmodium falciparum in febrile children in Asante-Akim. Ghana Malar J. 2018;17:468. [DOI] [PMC free article] [PubMed] [Google Scholar]
- 24.Kang J-M, Cho P-Y, Moe M, Lee J, Jun H, Lee H-W, Ahn SK, IM KIM, T., PAK, J. H. & MYINT, M. K. Comparison of the diagnostic performance of microscopic examination with nested polymerase chain reaction for optimum malaria diagnosis in Upper Myanmar. Malar J. 2017;16:119. [DOI] [PMC free article] [PubMed] [Google Scholar]
- 25.Kigozi R, Nuwaha F, Yeka A, et al. The accuracy of malaria rapid diagnostic tests in estimating plamodium falciparum density and resolving mixed malaria infection in a high transmission setting of Eastern Uganda. Malar J. 2017;16(1):4.28049475 [Google Scholar]
- 26.Satyarthi SK, Kumar K, Biswas S, et al. Interpretation errors in malaria rapid diagnostics tests can mislead surveillance and control efforts in elimination settings of India. Pathog Glob Health. 2018;112(8):433–40. [Google Scholar]
- 27.Waghmare R, Vibha D. Applications of artificial intelligence for malaria diagnosis: a systematic review. Malar J. 2020;19(1):78.32070355 [Google Scholar]
- 28.Hassan M, Cham F, Obare P, et al. Diagnostic Accuracy of a Deep Learning Model vs Health Workers to Interpret Malaria Rapid Diagnostic Tests: A Prospective Study. J Med Internet Res. 2020;22(8): e18645. [Google Scholar]
- 29.Satyarthi SK, Singh OP, Aditya H, et al. Deployment of automated digital microscopy and machine learning for malaria diagnosis in Chhattisgarh. India Pathog Glob Health. 2021;115(2):63–71. [Google Scholar]
- 30.Etcha T. Performance evaluation of Care Start™ Malaria Pf/Pv combo test at arbaminch general hospital and health center, Gamo Gofa Zone, South Ethiopia (Master's thesis). Ethiopia: Addis Ababa University (AAU); 2016.
- 31.Okell LC, Ghani AC, Lyons E, Drakeley CJ. Submicroscopic infection in Plasmodium falciparum-endemic populations: a systematic review and meta-analysis. J Infect Dis. 2009;200:1509–17. [DOI] [PubMed] [Google Scholar]
- 32.Bendezu J, Rosas A, Grande T, Rodriguez H, Llanos-Cuentas A, Escobedo J, Gamboa D. Field evaluation of a rapid diagnostic test (ParascreenTM) for malaria diagnosis in the Peruvian Amazon. Malar J. 2010;9:1. [DOI] [PMC free article] [PubMed] [Google Scholar]
- 33.Bayisa S, Kebede T, Bugssa G, Alemu M. Performance of SO Bioline FK80 test kit in diagnosis of malaria at Adama Malaria Center, southeast Oromia, Ethiopia. Science. 2015;3:31–6. [Google Scholar]
- 34.Tesfaye E. Major reproductive health problems, service preference, and utilization among high school adolescent girl students in Adama town, Oromiya region, Ethiopia (Master's thesis). Ethiopia: Addis Ababa University; 2014.
- 35.Sissay M, Gezahegne S. Current Status of the Prevalence of Malaria and its Associations with Knowledge Awarenees Anthropogenic Factors Climate and Abo Blood Groups in Adama District, Oromia Regional State. Ethiopia: Harmaya University; 2013. [Google Scholar]
- 36.Naing L, Winn T, Rusli B. Practical issues in calculating the sample size for prevalence studies. Arch Orofac Sci. 2006;1:9–1. [Google Scholar]
- 37.Beyene BB, Yalew WG, Demilew E, Abie G, Tewabe T, Abera B. Performance evaluation of rapid diagnostic tests for malaria in high-malarious districts of the Amhara region. Ethiopia Journal of vector-borne diseases. 2016;53:63. [PubMed] [Google Scholar]
- 38.Kozycki CT, Umulisa N, Rulisa S, Mwikarago EI, Musabyimana JP, Habimana JP, Karema C, Krogstad DJ. False-negative malaria rapid diagnostic tests in Rwanda: Impact of Plasmodium falciparum isolates lacking HRP2 and declining malaria transmission. Malaria J. 2017;16:123. 10.1186/s12936-017-1758-2. [DOI] [PMC free article] [PubMed]
- 39.Xiaodong S, Tambo E, Chun W, Zhibin C, Yan D, Jian W, Jiazhi W, Xiaonong Z. Diagnostic performance of CareStart™ malaria HRP2/pLDH (Pf/pan) combo test versus standard microscopy on falciparum and vivax malaria between China-Myanmar endemic borders. Malaria J. 2013;12:6. 10.1186/1475-2875-12-6. [DOI] [PMC free article] [PubMed] [Google Scholar]
- 40.WHO. Recommended selection criteria for procurement of malaria rapid diagnostic tests. Geneva: World Health Organization; 2018.
- 41.Thongdee P, Chaijaroenkul W, Kuesap J, Na-Bangchang K. Nested-PCR, and a new ELISA-based NovaLisa test kit for malaria diagnosis in anendemic areas of Thailand. Korean J Parasitol. 2014;52:377–82. [DOI] [PMC free article] [PubMed] [Google Scholar]
- 42.Woyessa A, Deressa W, Ali A, Lindtjørn B. Evaluation of CareStartTM malaria Pf/Pv combo test for Plasmodium falciparum and Plasmodium vivax malaria diagnosis in Butajira area, south-central Ethiopia. Malar J. 2013;12:218. [DOI] [PMC free article] [PubMed] [Google Scholar]
- 43.Malaria Rapid Diagnostic Test Performance: Results of WHO Product Testing of Malaria RDTs: Round 8 (2016–2018); WorldHealth Organization: Geneva, Switzerland, 2018. Available online: https://apps.who.int/iris/bitstream/handle/10665/276190/9789241514965-eng.pdf. 30 Mar 2022.
- 44.Kemleu S, Guelig D, Moukoko CE, Essangui E, Diesburg S, Mouliom A, Melingui B, Manga J, Donkeu C, Epote A. A Field-Tailored Reverse Transcription Loop-Mediated Isothermal Assay for High Sensitivity Detection of Plasmodium falciparum Infections. PLoS ONE. 2016;11:e0165506. [DOI] [PMC free article] [PubMed] [Google Scholar]
- 45.Oriero EC, Okebe J, Jacobs J, Nwakanma D, D’Alessandro U. Diagnostic performance of a novel loop-mediated isothermal amplification (LAMP) assay targeting the apicoplast genome for malaria diagnosis in a field setting in sub-Saharan Africa. Malar J. 2015;14:1. [DOI] [PMC free article] [PubMed] [Google Scholar]
- 46.Golassa L, Messele A, Amambua-Ngwa A, Swedberg G. High prevalence and extended deletions in Plasmodium falciparum hrp2/3 genomic loci in Ethiopia. PLoS ONE. 2020;15(11): e0241807. 10.1371/journal.pone.0241807. (PMID: 33152025). [DOI] [PMC free article] [PubMed] [Google Scholar]
- 47.Zhou H, Hickford J, Fang Q. A two-step procedure for extracting genomic DNA from dried blood spots on filter paper for polymerase chain reaction amplification. Anal Biochem. 2006;354:159–61. [DOI] [PubMed] [Google Scholar]
- 48.Snounou G. Detection and identification of the four malaria parasite species infecting humans by PCR amplification. Species Diagnostics Protocols: PCR and Other Nucleic Acid Methods. 1996;50:263–91. [DOI] [PubMed] [Google Scholar]
- 49.Singh N, Shukla MM, Shukla MK, Mehra RK, Sharma S, Bharti PK, Singh MP, Singh A, Gunasekar A. Field and laboratory comparative evaluation of rapid malaria diagnostic tests versus traditional and molecular techniques in India. Malar J. 2010;9:191. [DOI] [PMC free article] [PubMed] [Google Scholar]
- 50.Tseroni M, Pervanidou D, Tserkezou P, Rachiotis G, Pinaka O, Baka A, Georgakopoulou T, Vakali A, Dionysopoulou M, Terzaki I. Field Application of SD Bioline Malaria Ag Pf/Pan Rapid Diagnostic Test for Malaria in Greece. PLoS ONE. 2015;10: e0120367. [DOI] [PMC free article] [PubMed] [Google Scholar]
- 51.Nicastri E, Bevilacqua N, Schepisi MS, Paglia MG, Meschi S, Ame SM, Mohamed JA, Mangi S, Fumakule R, di Caro A. Accuracy of malaria diagnosis by microscopy, rapid diagnostic test, and PCR methods and evidence of antimalarial overprescription in nonsevere febrile patients in two Tanzanian hospitals. Am J Trop Med Hyg. 2009;80:712–7. [PubMed] [Google Scholar]
- 52.Golassa L, Enweji N, Erko B, Aseffa A, Swedberg G. Detection of a substantial number of submicroscopic Plasmodium falciparum infections by polymerase chain reaction: a potential threat to malaria control and diagnosis in Ethiopia. Malar J. 2013;12:352. [DOI] [PMC free article] [PubMed] [Google Scholar]
- 53.Umbers AJ, Unger HW, Rosanas-Urgell A, Wangnapi RA, Kattenberg JH, Jally S, Silim S, Lufele E, Karl S, Ome-Kaius M. Accuracy of an HRP-2/panLDH rapid diagnostic test to detect peripheral and placental Plasmodium falciparum infection in Papua New Guinean women with anaemia or suspected malaria. Malar J. 2015;14:412. [DOI] [PMC free article] [PubMed] [Google Scholar]
- 54.Alemu A, Fuehrer H-P, Getnet G, Kassu A, Getie S, Noedl H. Comparison of Giemsa microscopy with nested PCR for the diagnosis of malaria in North Gondar, north-west Ethiopia. Malar J. 2014;13:174. [DOI] [PMC free article] [PubMed] [Google Scholar]
- 55.Bastiaens GJH, Bousema T, Leslie T. Scale-up of malaria rapid diagnostic tests and artemisinin-based combination therapy: Challenges and perspectives in Sub-Saharan Africa. PLOS Med. 2014;11(1):e1001590. 10.1371/journal.pmed.1001590. [DOI] [PMC free article] [PubMed] [Google Scholar]
- 56.Eticha, T. 2016. Performance evaluation of Care StartTM Malaria Pf/Pv Combo Test at Arbaminch General Hospital and Health center, Gamo Gofa zone, South Ethiopia. AAU.
- 57.Hailu T, Kebede T. Assessing the performance of CareStart Malaria Pf/Pv Combo test against thick blood film in the diagnosis of malaria in northwest Ethiopia. Am J Trop Med Hyg. 2014;90:1109–12. [DOI] [PMC free article] [PubMed] [Google Scholar]
- 58.Moges B, Amare B, Belyhun Y, Tekeste Z, Gizachew M, Workineh M, Gebrehiwot A, Woldeyohannes D, Mulu A, Kassu A. Comparison of CareStart™ HRP2/pLDH COMBO rapid malaria test with light microscopy in north-west Ethiopia. Malar J. 2012;11:234. [DOI] [PMC free article] [PubMed] [Google Scholar]
- 59.Ahmed R, Levy EI, Maratina SS, de Jong JJ, Asih PB, Rozi IE, Hawley W, Syafruddin D, ter Kuile F. Performance of four HRP-2/pLDH combination rapid diagnostic tests and field microscopy as screening tests for malaria in pregnancy in Indonesia: a cross-sectional study. Malar J. 2015;14:420. [DOI] [PMC free article] [PubMed] [Google Scholar]
- 60.Alareqi LM, Mahdy MA, Lau Y-L, Fong M-Y, Abdul-Ghani R, Ali AA, Cheong F-W, Tawfek R, Mahmud R. Field evaluation of a Pf HRP-2/pLDH rapid diagnostic test and light microscopy for diagnosis and screening of falciparum malaria during the peak seasonal transmission in an endemic area in Yemen. Malar J. 2016;15:49. [DOI] [PMC free article] [PubMed] [Google Scholar]
- 61.Andrade BB, Reis-Filho A, Barros AM, Souza-Neto SM, Nogueira LL, Fukutani KF, Camargo EP, Camargo LM, Barral A, Duarte Â. Towards a precise test for malaria diagnosis in the Brazilian Amazon: comparison among field microscopy, a rapid diagnostic test, nested PCR, and a computational expert system based on artificial neural networks. Malar J. 2010;9:117. [DOI] [PMC free article] [PubMed] [Google Scholar]
- 62.Heutmekers M, Gillet P, Maltha J, Scheirlinck A, Cnops L, Bottieau E, van Esbroeck M, Jacobs J. Evaluation of the rapid diagnostic test CareStart pLDH Malaria (Pf-pLDH/pan-pLDH) for the diagnosis of malaria in a reference setting. Malar J. 2012;11:204. [DOI] [PMC free article] [PubMed] [Google Scholar]
- 63.Alam MS, Mohon AN, Mustafa S, Khan WA, Islam N, Karim MJ, Khanum H, Sullivan DJ, Haque R. Real-time PCR assay and rapid diagnostic tests for the diagnosis of clinically suspected malaria patients in Bangladesh. Malar J. 2011;10:175. [DOI] [PMC free article] [PubMed] [Google Scholar]
- 64.Harris I, Sharrock WW, Bain LM, Gray K-A, Bobogare A, Boaz L, Lilley K, Krause D, Vallely A, Johnson M-L. A large proportion of asymptomatic Plasmodium infections with low and sub-microscopic parasite densities in the low transmission setting of Temotu Province, Solomon Islands: challenges for malaria diagnostics in an elimination setting. Malar J. 2010;9:254. [DOI] [PMC free article] [PubMed] [Google Scholar]
- 65.Rodulfo H, de Donato M, Mora R, Gonzalez L, Contreras C. Comparison of the diagnosis of malaria by microscopy, immunochromatography and PCR in endemic areas of Venezuela. Braz J Med Biol Res. 2007;40:535–43. [DOI] [PubMed] [Google Scholar]
- 66.Kain KC, Lanar DE. Determination of Plasmodium species infecting a human host by multiplex polymerase chain reaction and malaria hot spot looping. Am J Trop Med Hyg. 2008;78(2):200–4. [Google Scholar]
- 67.Automated image analysis for the diagnosis of malaria in finger-prick whole blood. Nat Med. 2023;29(1):107–115. 10.1038/s41591-022-02043-7.
- 68.Performance of a deep learning algorithm for the diagnosis of malaria in finger-prick blood samples. (2022). Lancet Digital Health. 4(12):e945-e954 10.1016/S2589-7500(22)00290-0.
- 69.World Health Organization. (2023). Malaria diagnosis. https://www.who.int/news-room/fact-sheets/detail/malaria.
Associated Data
This section collects any data citations, data availability statements, or supplementary materials included in this article.
Data Availability Statement
The corresponding author have access to original data of the study. The final draft of the publication has been thoroughly reviewed and approved by all authors, who had complete access to all the study data. They bear only responsibility for ensuring the accuracy and integrity of the data analysis.