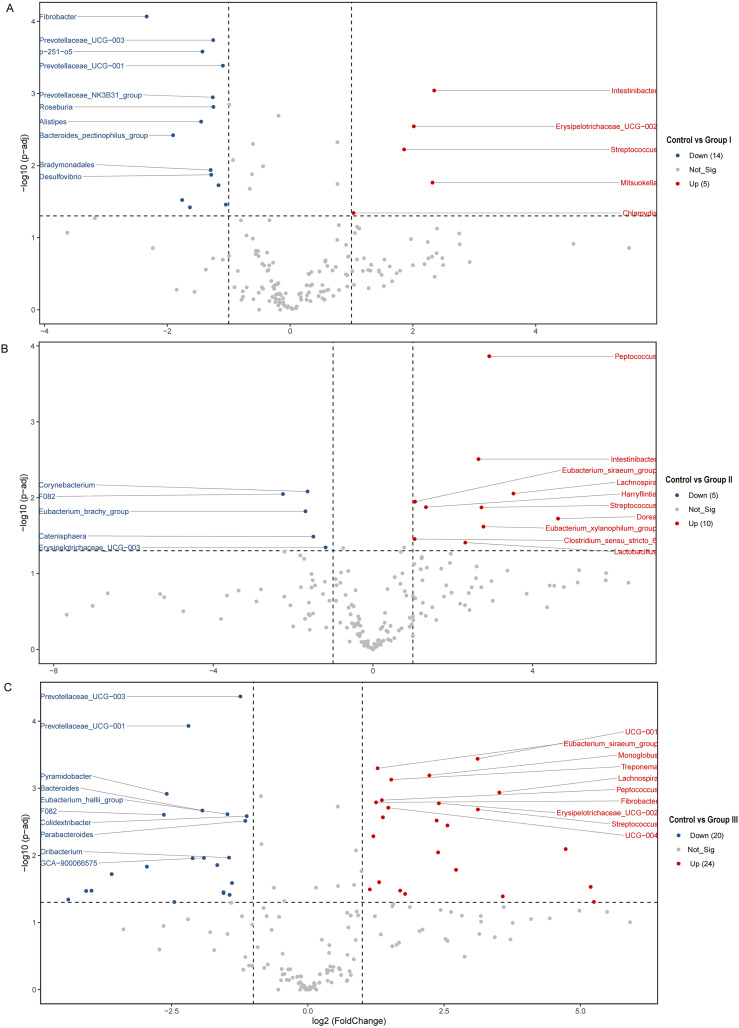
Figure 5. (A–C) Volcano blot of differences in colonic microbiota between control and the various dietary groups of Hezuo pigs.
Each point in the diagram signifies a distinct species, with “Up” indicating a species that exhibits greater abundance in the first comparison group compared to the second, while “Down” denotes the contrary. The names of the top ten species were presented based on their significance ranking.

