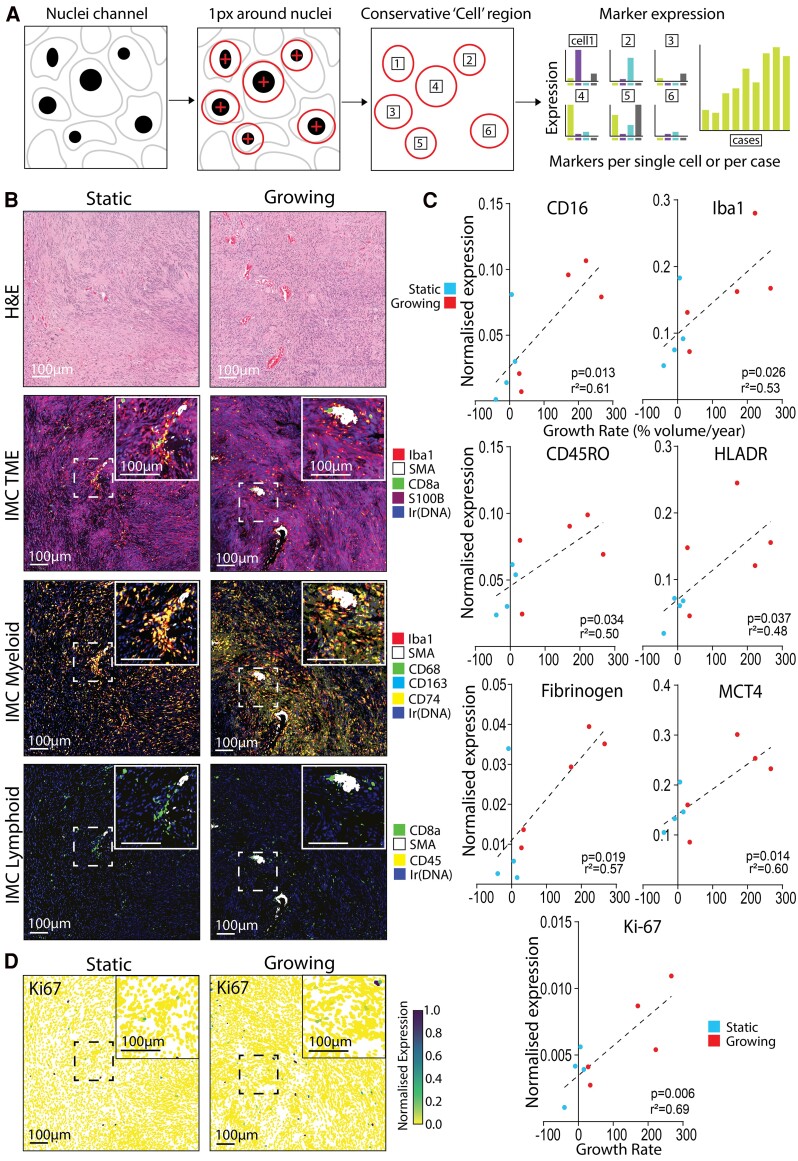
Figure 1.
Enriched expression of myeloid and effector T cell markers correlate with growth rate in VS. (A) Schematic detailing how single cell expression data were generated from hyperion IMC images. (B) H&E and IMC-stained static and growing VS tissue (volume change/year < 20% or ≥ 20%, respectively) where inserts highlight areas of vascular-associated higher immune cell density within the VS region of interest. IMC images illustrate cell state–specific markers for general tumour micro-environment, myeloid cells and lymphoid cells. (C) Single-cell expression data extracted from the IMC images from four static (three male and one female) and five growing (four male and one female) VS and single-cell marker expression was averaged per case. All markers with expression that significantly correlated with volumetric growth rate are visualized. Shapiro–Wilk normality test followed by two-tailed Pearson correlation with simple linear regression. Correlation coefficient significance when P < 0.05. (D) Single-cell normalized expression of Ki-67, marker of cell proliferation, across all cells within the same regions of interest for static and growing VS displayed in (B). All scale bars denote 100 µm.

