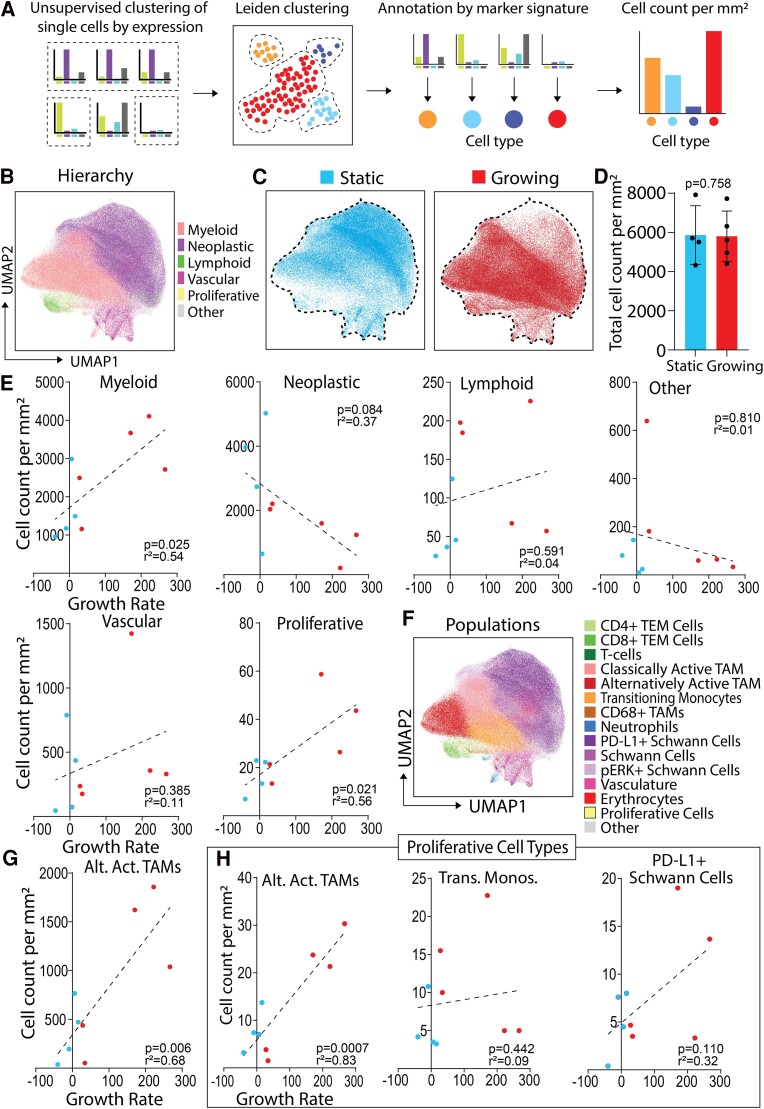
Figure 2.
Myeloid alternatively activated TAMs correlate with VS growth rate and have increased proliferative marker expression. (A) Schematic detailing of how single-cell expression data were clustered and annotated into specific cell type populations. (B) Leiden clustering of all single cells from four static (three male and one female) and five growing (four male and one female) VS manually annotated into hierarchical cell types, visualized by UMAP. Static or growing VS were defined as volume change/year < 20% or ≥ 20%, respectively. (C) UMAPs of single cells from either static or growing VS. (D) Total cell count per millimetre square from static (N = 4) or growing (N = 5) cases. Shapiro–Wilk normality test followed by two-tailed unpaired t-test. Statistical significance when P < 0.05. (E) Correlations of cell count per millimetre square of hierarchical cell types per case (N = 9) with VS growth rate. Shapiro–Wilk normality test followed by two-tailed Pearson correlation or two-tailed Spearman correlation with simple linear regression for cell count per millimetre square against growth rate. Correlation coefficient significance when P < 0.05. (F) Leiden clustering and annotation of the six hierarchical cell types into 15 more granular populations, visualized on UMAP. (G and H) Statistical analysis as per (E). Alternatively activated TAMs correlated with volumetric growth rate (G). Growth rate correlations from Leiden sub-clustering of proliferative cells into proliferative populations of alternatively activated TAMs, transitioning monocytes and PD-L1+ Schwann cells (H). Alt. Act. TAMs, alternatively activated TAMs; trans. monos., transitioning monocytes.

