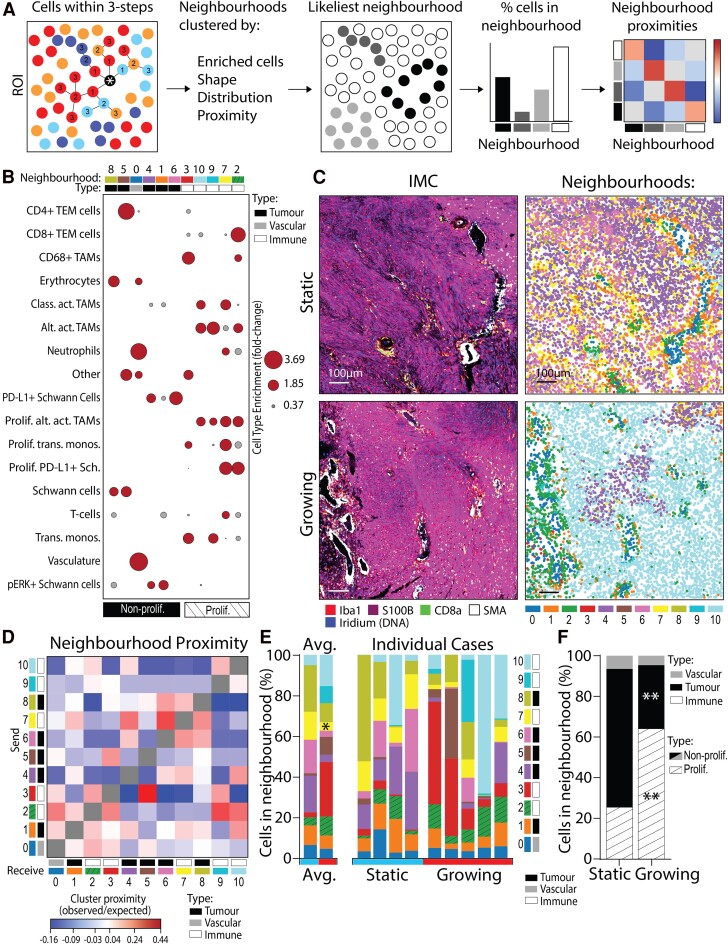
Figure 3.
Growing VS have more cells residing in proliferative, immune-enriched neighbourhoods. (A) Schematic detailing how the cells within a three-step connection from the target cell define a single cell’s local environment (neighbourhood). (B) Cell types enriched within each neighbourhood plotted and used to annotate whether neighbourhoods were tumour-enriched, vasculature-enriched or immune-enriched, as well as whether they contained proliferative cells. Fold change (FC) of cell type enrichment represented by node size, with grey FC < 1 and red FC ≥ 1. Neighbourhood cell type enrichment analysis included all cells from all VS cases (N = 9). (C) IMC images with matched neighbourhood plots of cells coloured by 11 annotated neighbourhoods. Scale bars denote 100 µm. (D) Neighbourhood proximity analysis used pairwise analytical neighbourhood enrichment (CellCharter) to define whether pairs of the 11 neighbourhoods were likely to associate positively or negatively with one-another when compared with random chance (observed/expected). Neighbourhood proximity analysis included all cells from all VS cases (N = 9). (E) Proportions of cells within each neighbourhood by individual case and averaged from in four static (three male and one female) and five growing (four male and one female) VS. Static or growing VS defined as volume change/year < 20% or ≥ 20%, respectively. Shapiro–Wilk normality test followed by Mann–Whitney test for static (N = 4) and growing (N = 5) cases. (F) Proportion of cells in proliferative/non-proliferative neighbourhoods in static and growing VS, as per annotation in (D). Shapiro–Wilk normality test followed by 2-way ANOVA for static (N = 4) and growing (N = 5) cases. Statistical significance *P < 0.05, **P < 0.01. Prolif., proliferative; Alt. Act. TAMs, alternatively activated TAMs; Class. Act. TAMs, classically activated TAMs; trans. monos., transitioning monocytes; IMC, imaging mass cytometry.

