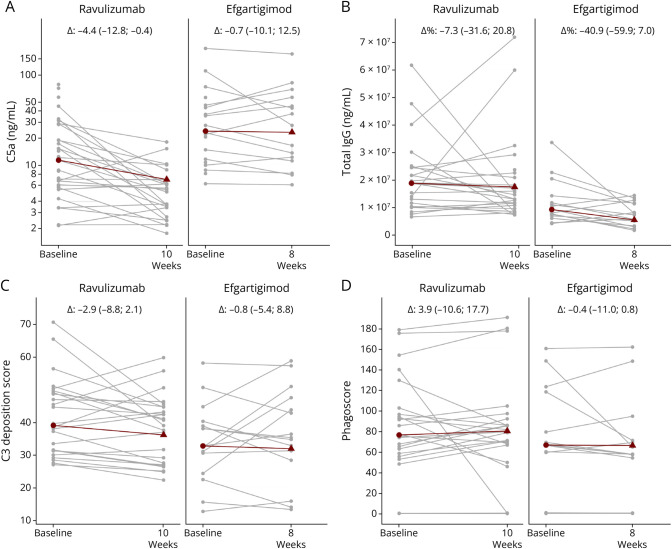
Figure 2. Profiling Activated Complement Protein and IgG Levels Along With AChR-Specific Antibody Effector Functions on Treatment Initiation With Ravulizumab and Efgartigimod.
(A) Serum complement C5a and (B) total igG protein levels were quantified at baseline, at 10 weeks after ravulizumab therapy, and 8 weeks after initiation of efgartigimod therapy. Only ravulizumab-treated patients presented with a significant decrease in terminal complement factors C5a (p = 0.00024). Only efgartigimod-treated patients presented with a significant decrease in total IgG levels (p = 0.03). Mean relative difference for total IgG levels in efgartigimod-treated patients is −22.0 and for ravulizumab-treated patients is 8.2. (C) Antibody-dependent complement deposition and (D) phagocytosis induced by isolated AChR-specific IgG quantified at baseline, at 10 weeks after ravulizumab therapy, and 8 weeks after initiation of efgartigimod therapy. Indicated in gray are individual patients. Indicated in red are the median at baseline and median differences for follow-up along with the interquartile range. AChR = acetylcholine receptor; IgG = immunoglobulin G.

