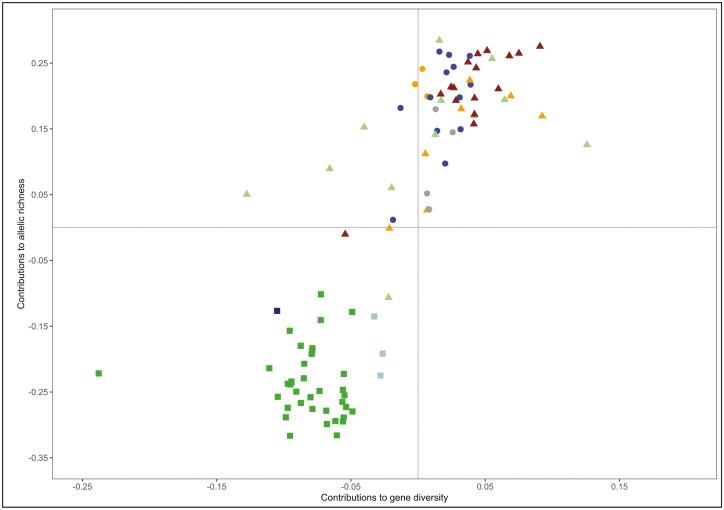
Figure. 3.
Dispersion plot illustrating the subpopulations contributions to gene diversity (X-axis) and allelic richness (Y-axis) assessed using the whole dataset. The Cosmopolitan pig outgroup was not plotted. American Creole pig subpopulations are in blue circles, American Feral subpopulations in orange circles and Other American pig subpopulations in gray circles; Chinese subpopulation are in green squares, Thai pig subpopulations in light blue squares and the Korean Local subpopulation is in dark blue square; Mediterranean pig subpopulations are in light green triangles, UK pig subpopulations in orange triangles, and Other European pig subpopulations are in brown triangles.

