. 2024 Nov 28;13:RP95172. doi: 10.7554/eLife.95172

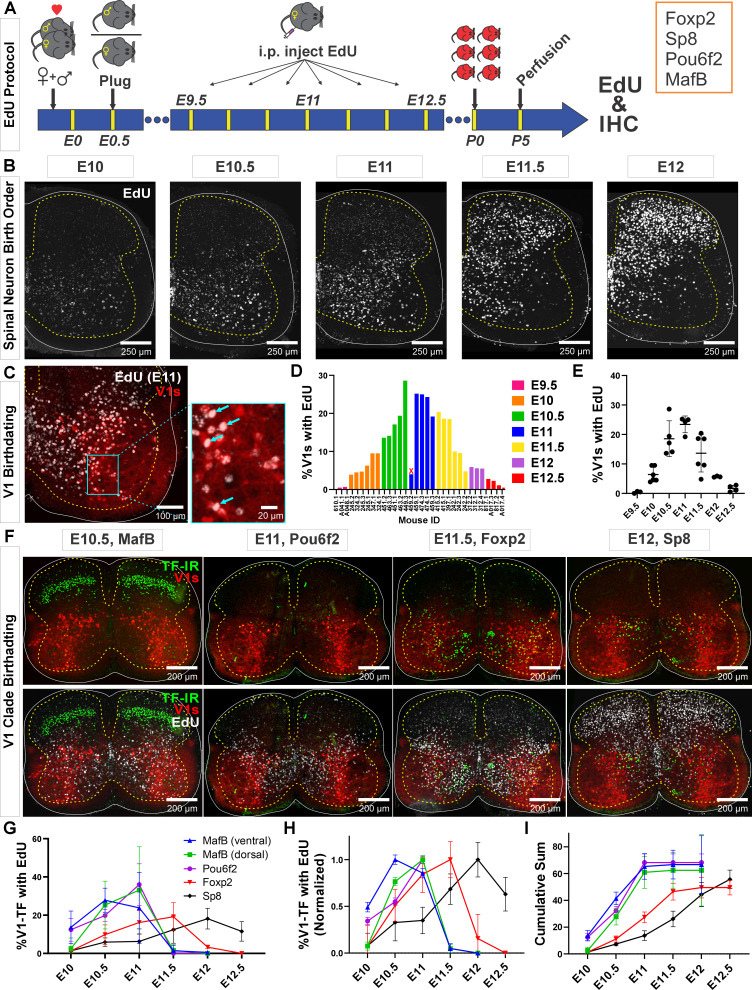
Figure 1. Neurogenesis order of V1 clades assayed by 5-ethynyl-2'-deoxyuridine (EdU) birthdating.

(A) Experimental design. Timed pregnant En1cre,Ai9 R26lsl-tdT females were EdU-injected at one of seven time points between E9.5 and E12.5, and the spinal cords harvested at P5. Tissue sections were processed for EdU (Click-iT) and immunostained for representative transcription factors (TFs) of major V1 clades. MafB was used to identify the MafA-Renshaw cell clade by location (‘ventral MafB-V1 cells’). (B) EdU labeling at different embryonic times. Spinal neurons are born in a ventrolateral to dorsomedial sequence. (C) Example of E11 EdU labeling in an En1-tdT spinal cord. EdU integrated in the DNA at the time of injection is diluted with subsequent cell divisions. To ensure we sampled V1 cells that incorporated EdU during S-phase after their final division, we only counted V1 cells with nuclei filled by EdU Click-iT reaction (arrows). Partially labeled nuclei (speckles) in the image were not counted. (D) Percentages of V1 cells labeled with ‘strong’ EdU in each mouse. The x-axis indicates individual animals (‘<litter number>.<animal number>’). The percentage of EdU-labeled V1 interneurons at each time point was consistent, although we also noted variability between litters and among animals within a litter. One animal (459.2) showed the wrong EdU pattern for its injection age and was discarded (indicated by an X). (E) EdU birthdating reveals a peak in V1 neurogenesis around E11 (error bars = SD; each dot represents one animal). At the time points flanking the peak there is a larger amount of variability, suggesting a fast-changing pace in V1 neurogenesis. (F) Representative images of TF antibody staining combined with EdU labeling to determine birthdates of defined V1 clades. The time points represented were selected according to the maximal or near-maximal generation of V1 interneurons in each clade. (G–I) V1-clade neurogenesis quantification. Graphs represent the average ± SEM calculated from n=3.9 ± 0.3 mice per TF/date (not all TFs were tested in all mice). For each mouse average, we analyzed four ventral horns in Lumbar 4 or 5 segments (further details of sample structure are explained in the results section). (G) Percentage of V1s expressing each clade-specific TF labeled with EdU at each embryonic time point. Ventral MafB-V1s (Renshaw cells) and Pou6f2-V1s are mostly born before E11 (dorsal MafB-V1s are a subgroup of Pou6f2-V1s). Foxp2-V1 and Sp8-V1 interneurons have wider windows of neurogenesis, but most are generated after E11. (H) Data normalized to the maximum percentage of V1s born in each group showing peak generation in each clade. Ventral MafB-V1s, Pou6f2-V1s, Foxp2-V1s, and Sp8-V1s have progressively later times of peak generation. (I) Cum-sum graphs of V1-clades neurogenesis. Between 50% and 68% of all neurons in each V1 clade are labeled across all ages. By E11 nearly all neurons in early clades are generated, while fewer than half of neurons in late clades are.

Figure 1.

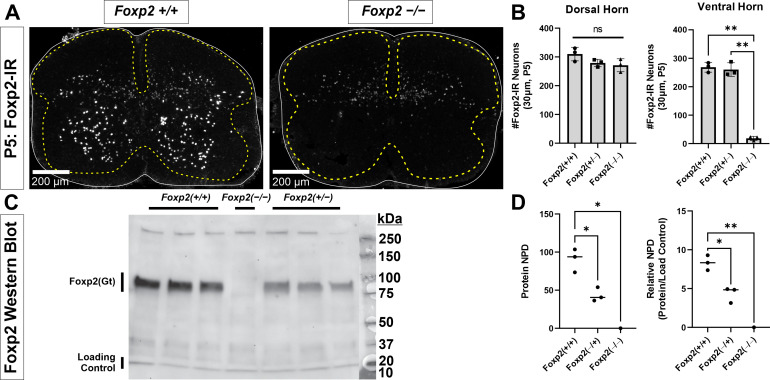
Figure 1—figure supplement 1. Foxp2 antibody characterization.

Figure 1—figure supplement 1.

(A) P5 spinal cords from wild-type (WT) (Foxp2+/+) and Foxp2 knockout mice (KO: Foxp2flpo/flpo) immunostained with Santa Cruz goat polyclonal anti-Foxp2 antibody (N-16, Lot#G2911). All nuclear immunostaining in the ventral horn and lateral dorsal horn are absent in KO tissues, however some weak immunoreactivity remains in the dorsal horn. This suggests a weak cross-reaction with another epitope present only in dorsal horn cells. (B) Quantification of immunoreactive cell nuclei in the dorsal and ventral horns. For these analyses, a line was drawn horizontally from the top of the central canal to separate dorsal and ventral horns. In 30-µm-thick sections from P5 tissue, the number of Foxp2-IR cells in the dorsal horn is similar in WT (Foxp2+/+), Foxp2 hets (Foxp2flpo/+), and Foxp2 KOs (Foxp2flpo/flpo). Each dot represents one spinal cord serial section from three littermates each with a different genotype. A one-way ANOVA detected no significant differences (F(2,6) = 3.100, p=0.1190). This is likely because the number of weakly labeled spots greatly outnumbers the strongly labeled nuclei that disappear from the image. Thus, the comparison does not have enough power for the expected, relatively small difference in number (power for α=0.05:0.275 which is smaller than desired power of 0.800). We did not pursue this further because our focus is on ventral horn Foxp2 neurons. In the ventral horn there are mostly strongly labeled nuclei and, correspondingly, all disappear from the spinal cord with only a few exceptions of weak labeling. A one-way ANOVA detected significant differences (F(2,6) = 3.100, p<0.0001) and this comparison was adequately powered (power for α=0.05:1.000). Post hoc pairwise comparisons (Bonferroni-corrected t-tests) showed that WT (Foxp2+/+) and Foxp2 hets (Foxp2flpo/+) were significantly different to Foxp2 KOs (Foxp2flpo/flpo) (WT vs KO: p<0.0001 t(6)=17.41; het vs KO: p<0.0001 t(6)=16.83) but not in between them (WT vs het: p>0.9999 t(6)=0.5797) suggesting that heterozygosis did not affect the number of ventral horn interneurons detected using immunolabeling. In summary, our antibody detects Foxp2 expression in the ventral horn with high sensitivity and specificity. (C) Antibody specificity confirmed via western blot. Spinal cords from P5 mice from a single litter were extracted and immediately homogenized in a nuclear extraction solution containing protease inhibitors (NE-PER Nuclear and Cytoplasmic Extraction [Thermo Fisher]; cOmplete Protease Inhibitor Cocktail [Roche]). The nuclear fraction was used for the protein assay and subsequent western blot. Blots were stained with antibodies against Foxp2 (N-16, Santa Cruz) and, as a loading control, against acetyl-Histone H3 (Rabbit, EMD Millipore, 06-599). A single Foxp2 band is revealed at the expected theoretical 80 kDa molecular weight. This band disappears in the Foxp2 KO lane (Foxp2flpo/flpo). (D) Western blot quantification. Protein content was estimated measuring the normalized pixel density (NPD = pixel density in ROI encompassing stained bands – pixel density of same ROI placed just above the band) in the Foxp2 band and relative to the NPD of the respective loading controls in each lane. Foxp2 protein was undetectable in the Foxp2 KO lane (Foxp2flpo/flpo). In WT animals we detected almost double the amount of Foxp2 protein compared to hets (Foxp2flpo/+), and this difference was significant (two-tailed t-test t(4) = 5.004, p=0.0075). This suggests that Foxp2 gene expression is halved in hets, but this does not affect detectability of Foxp2 ventral horn interneurons which were similar in number in hets vs WTs (see B). In this graph each dot is one animal/lane and the average ± SD indicated. Raw images of the blots and corresponding labeling are found in Figure 1—figure supplement 1—source data 1 and Figure 1—figure supplement 1—source data 2.
Figure 1—figure supplement 1—source data 1. Raw images of gel corresponding to Figure 1—figure supplement 1C.
Figure 1—figure supplement 1—source data 2. Annotated full image of gel corresponding to Figure 1—figure supplement 1C.
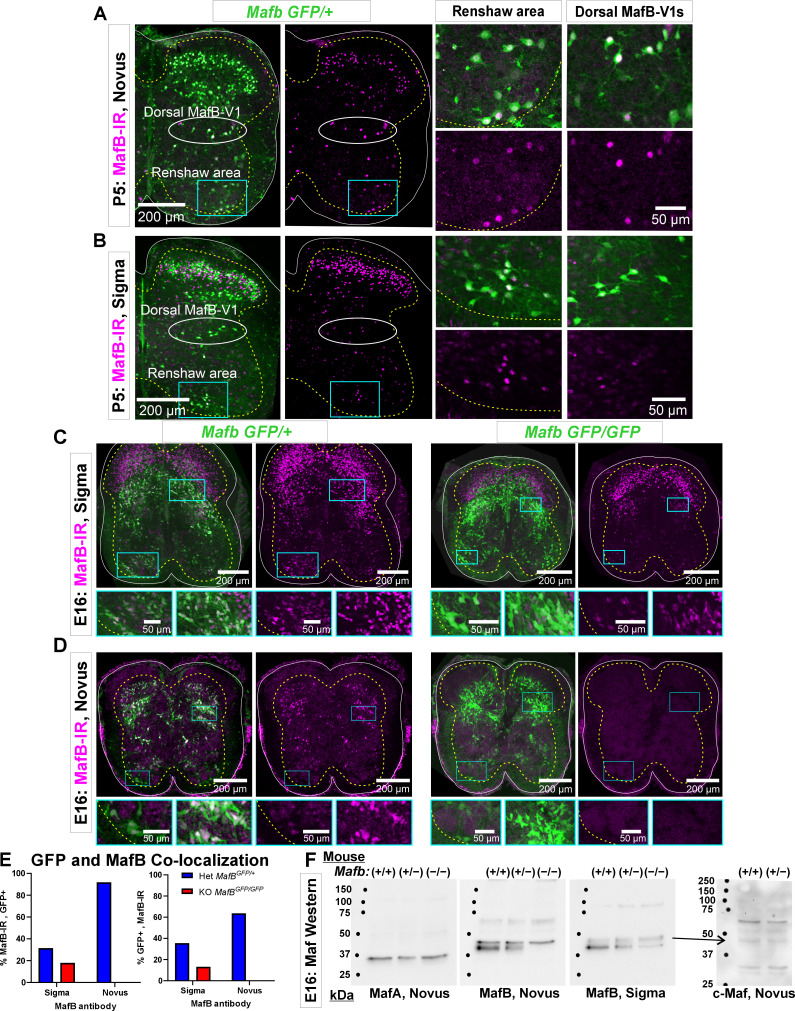
Figure 1—figure supplement 2. Each antibody was directed against different regions of the mouse MafB protein: aa18–167 for the Sigma antibody (Lot#A31532) and aa100–150 for the Novus antibody (lot#1).

Figure 1—figure supplement 2.

These target sequences are shared with mouse MafA and c-Maf, but the overlap is larger with the Sigma antibody immunogen. A BLAST sequence search found 98%, 53%, and 64% significant alignment between the MafB sequence used for creation of the Sigma antibody with, respectively, aa18–140 in mouse MafB, aa18–143 in mouse MafA, and aa19–118 in mouse c-Maf. The sequence used in the Novus antibody detected no alignment with proteins other than mouse MafB. (A) P5 spinal cord from a MafbGFP/+ mouse immunostained with MafB-Novus antibodies. GFP (green) reports mafb gene expression (see Figure 1—figure supplement 3). Immunohistochemistry detects MafB protein (Cy3, magenta). Higher magnifications of the indicated areas, including the dorsal and ventral (Renshaw) MafB-V1 groups, are shown to the right. (B) P5 spinal cord from a MafbGFP/+ mouse immunostained with MafB-Sigma antibodies. The MafB-Sigma antibody detects many more dorsal horn neurons than the MafB-Novus antibody. Many interneurons at this location are known to express c-Maf. In the ventral horn MafB-immunoreactivity is qualitatively similar for both antibodies. This includes both the regions occupied by V1 Renshaw cells and by dorsal-MafB-V1s (Pou6f2-V1 clade). (C) Immunoreactivity against MafB-Sigma antibodies in het (MafbGFP/+) and KO (MafbGFP/GFP) tissue from E16 MafB-GFP reporter mice (the MafB KO is lethal at P0 because it cannot breathe on its own). Low-magnification images of MafB-GFP and MafB-immunoreactivity combined (left panel) or MafB-immunoreactivity alone (right panel) in the het (left pair) and the KO mouse (right pair). The boxed ventral and dorsal horn areas are magnified below. GFP in MafB-GFP mice reports activity of the mafb promoter, but the knocked-in GFP inactivates the Mafb allele. When both alleles carry GFP (KO, MafbGFP/GFP), GFP reports cells with gene expression from the Mafb locus although no Mafb mRNA or protein is produced. In the het mouse one allele produces Mafb mRNA: in this tissue, there is a high degree of overlap between GFP and protein immunoreactivity in the ventral and deep dorsal horns. However, there is more MafB-Sigma immunoreactivity than GFP in superficial laminae. In the KO, ventral horn immunoreactivity is greatly diminished, but lingering weak immunoreactivity remains in many neurons, including Renshaw cells. This could represent cross-reaction with MafA in the tissue. Most MafB-Sigma immunoreactivity in superficial laminae remains in the KOs suggesting that these cells strongly express a cross-reacting target and frequently do not express Mafb (GFP negative). This is most likely c-Maf which is highly expressed in laminae I to III neurons. (D) As in C, for MafB-Novus antibodies. Unlike MafB-Sigma, there is little MafB-immunoreactivity in the het animal outside GFP+ cells reporting MafB expression; this includes superficial laminae cells. All immunoreactivity disappears in the KO animal. (E) Ventral horn co-localization of MafB-GFP and MafB-immunoreactivity obtained with Sigma and Novus antibodies. Graphs show the percentage of immunoreactive cells that are GFP+ (left) and the percentage of GFP+ cells that co-localize the indicated MafB antibody immunoreactivity (right). In one spinal cord ventral horn section from a het mouse (blue bars), we sampled 441 cells with MafB-Sigma immunoreactivity, but the same section had fewer MafB-GFP cells (n=392) such that only a small number of cells co-localized both markers (n=139). In total, 31.5% of MafB-Sigma immunoreactive cells expressed GFP and 35.5% of GFP+ cells had MafB-Sigma immunoreactivity. Conversely, in a serial section immunolabeled with the Novus antibody we detected fewer MafB-Novus immunoreactive cells (n=149) than MafB-GFP cells (n=215) and the large majority were GFP+ (92.0%, n=137). There was almost no MafB-Novus immunoreactivity outside GFP+ cells. Thus, the MafB-Novus antibody is more restricted to GFP+ cells than the MafB-Sigma antibody. In addition, 63.7% of GFP+ cells express MafB-Novus immunoreactivity and while putative dorsal-MafB V1 cells express strong MafB-Novus immunoreactivity this is weak in Renshaw cells. In one MafB KO section (red bars) we detected 217 MafB-Sigma immunoreactive cells and 296 GFP+ cells with 39 cells co-localizing both markers. This corresponded to 17.9% of MafB-immunoreactive cells expressing GFP and 13.2% of the GFP+ cells expressing MafB-Sigma immunoreactivity. The MafB-Novus antibody showed no MafB-immunoreactivity in KO tissue sections with similar numbers of GFP+ cells (n=241). (F) Western blots of MafA (Novus), MafB-Novus, and MafB-Sigma on nuclear extracts from one WT (Mafb+/+), one Mafb heterozygous (het, MafbGFP/+), and one Mafb knockout (KO, MafbGFP/GFP), all E16 littermates. The same western blot was stripped and re-probed three times with the antibodies in the following order: MafB-Novus, MafA-Novus, and finally MafB-Sigma. The MafA antibody shows a single band just below the 37 kDa marker, aligning with a predicted molecular weight of 37.6 kDa. The band is of similar size in all three lanes suggesting no compensatory change in MafA expression in Mafb hets and KOs. Neither of the MafB antibodies detected the MafA band in western blots, suggesting that any possible cross-reaction in tissue is due to IgG species detecting secondary or tertiary protein structures. MafB antibodies generated a double band, with the upper band being weaker than the lower band for MafB-Sigma compared to MafB-Novus. The immunoreactivity of the lower band to MafB-Sigma diminished in hets compared to WTs and diminished further in the KO. This band completely disappeared in the KO probed with MafB-Novus antibodies. This suggest that this band corresponds to MafB and occurs at approximately 40 kDa, slightly over the predicted 35.8 kDa molecular weight. Both antibodies detected a higher molecular weight band that does not change with gene dose. This could correspond to c-Maf with a larger predicted molecular weight, 38.5 kDa. Therefore, we performed a new western blot using a c-Maf antibody from Novus, and we found a correspondence between the upper band detected by both MafB antibodies with one of the bands in the c-Maf western blots. This suggests that in western blots both MafB antibodies cross-reacted with c-Maf. Raw images of the blots and corresponding labeling are found in Figure 1—figure supplement 2—source data 1, Figure 1—figure supplement 2—source data 2, and Figure 1—figure supplement 2—source data 3.
Characterization of MafB (Novus, NB600-266) and MafB (Sigma, HPA00563) antibody immunoreactivities in the spinal cord.
Figure 1—figure supplement 2—source data 1. Raw images of triple probed gel corresponding to Figure 1—figure supplement 2F.
Figure 1—figure supplement 2—source data 2. Annotated images of triple probed gel corresponding to Figure 1—figure supplement 2F.
Figure 1—figure supplement 2—source data 3. Annotated full image of c-Maf probed gel corresponding to Figure 1—figure supplement 2F.
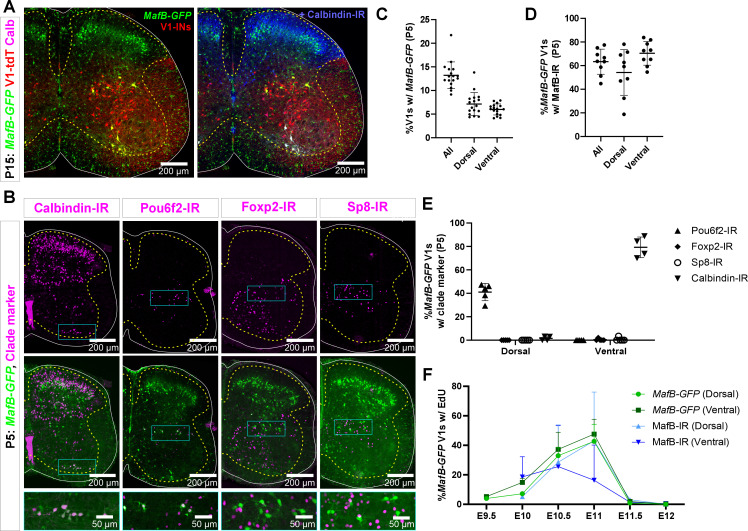
Figure 1—figure supplement 3. MafB-V1s visualized in a MafB-GFP mouse model.

Figure 1—figure supplement 3.

(A) MafB-GFP+ cells in mature (P15) mice. Most MafB-GFP+ cells in lamina VII belong to the V1 lineage (tdTomato). They are found in the most dorsal and ventral regions of the distribution of V1s. Those that are also calbindin-IR fall in the distinctive ventral region occupied by Renshaw cells. In addition, there are many dorsal horn non-V1 MafB-GFP+ neurons. The small cells throughout the white and gray matter are microglia. (B) Expression of transcription factors (TFs) and calbindin in MafB-GFP+ cells in neonatal (P5) mice. Top row, immunoreactivity for calbindin (Renshaw cells) and clade-specific TFs. Bottom row, superimposition with MafB-GFP (V1-tdTomato is not shown for simplicity). Compared to P15, a few more ventral horn neurons express MafB-GFP at P5, including some motoneurons, but MafB labeling is weaker in these cells. Within MafB-GFP+ V1 neurons, the two groups located at the most dorsal and most ventral regions correspond to the V1 neurons that retain MafB-GFP at P15 (see A). These groups are indicated with rectangles in the figure. The ventral group expresses calbindin. The dorsal group expresses Pou6f2 at this age. Little-to-no Foxp2-IR or Sp8-IR is found in either dorsal or ventral groups of MafB-GFP+ V1s. (C) Quantitation of MafB-V1 neurons in P5 mice. Around 13% of all V1s express MafB-GFP+, and the percentages located in the Renshaw cell area (‘ventral’) or dorsal lamina VII (‘dorsal’) are evenly split (n=17 mice, 4 ventral horns each; bars show SD). (D) More than half of the MafB-GFP+ V1 cells have detectable levels of MafB (Sigma) immunoreactivity at P5, in both the ventral and dorsal groups (n=9 mice, 4 ventral horns each; error bars show SD). (E) V1-clade marker expression in dorsal and ventral P5 MafB-GFP V1 neurons. Dorsal MafB-GFP-V1s express Pou6f2, but do not express calbindin, Sp8, or Foxp2. Ventral MafB-GFP-V1s express calbindin (Renshaw cells) and do not express Pou6f2, Foxp2, or Sp8 (n=4–5 mice, 4 ventral horns each; error bars show SD). (F) 5-Ethynyl-2'-deoxyuridine (EdU) birthdating reveals similar proportions of EdU+ neurons at P5 for dorsal MafB-GFP vs MafB-IR neurons pulse-labeled at each embryonic time point (n=2 mice per time point per condition, 4 ventral horns each; error bars show SD). The mismatch in birthdates between MafB genetic and antibody labeling at E11 in the ventral group could arise because some E11-born ventral MafB-GFP V1s quickly downregulate MafB to levels that are undetectable with antibodies.