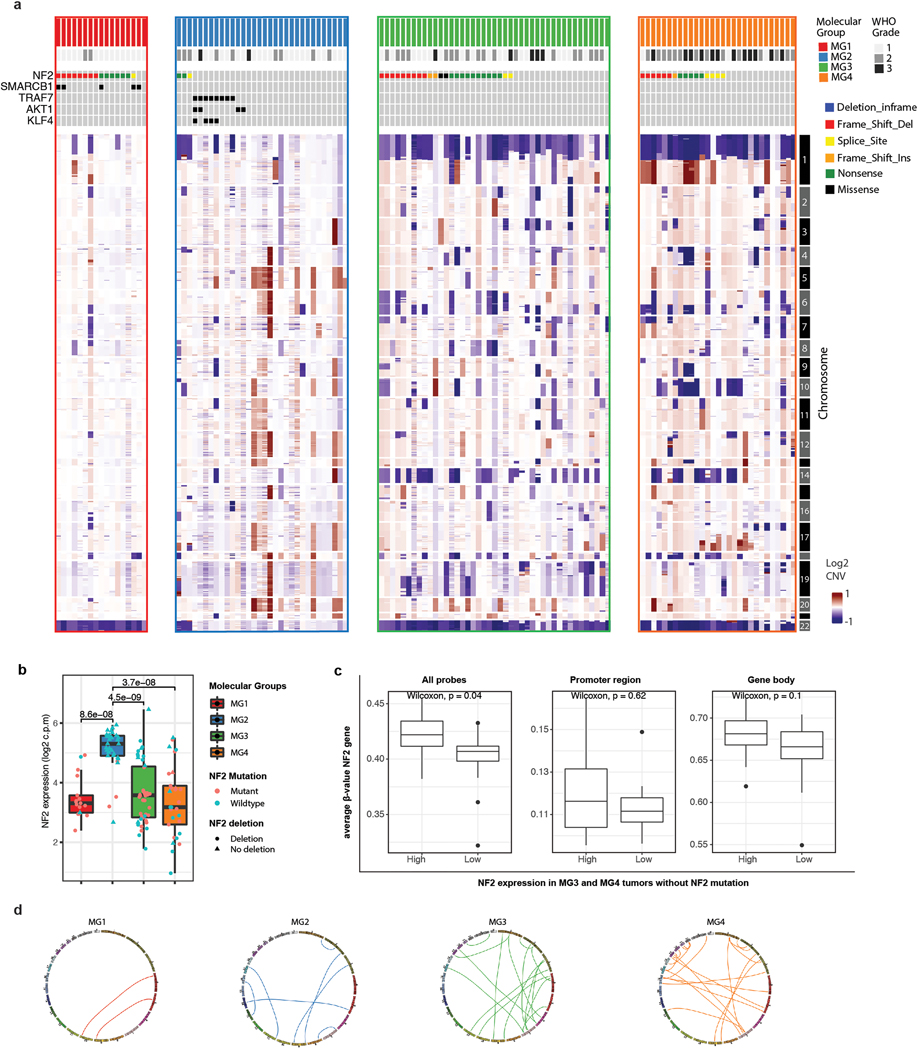
Extended Data Fig. 4: Genomic disruptions differ among molecular groups.
a, Genome-wide copy-number alterations computed from whole-exome sequencing data. Arrangements of copy number profile are matched to the samples from mutation plot above. Only mutations that are relevant to discussion in text are shown.
b, Boxplots showing the mRNA expression of NF2 stratified by molecular group. Each dot is a sample. Samples are colored by NF2 mutation status and shapes are according to NF2 deletion status by CNA. Some MG3 and MG4 meningiomas that are NF2 wildtype show silencing of NF2 expression.
c, Boxplots comparing the mean methylation level of NF2 wildtype MG3 and MG4 meningiomas with high versus low NF2 expression using all probes (left), those mapping to the promoter region (middle), and those mapping to the gene body (right).
d, Circos plot showing the landscape of interchromosomal gene rearrangements detected using a stringent threshold for conservative estimation of fusion events (unique spanning reads ≥ 25) in each molecular group. Total number of interchromsomal fusion in MG1, MG2, MG3 and MG4 are 2, 7,18, and 23, respectively.

