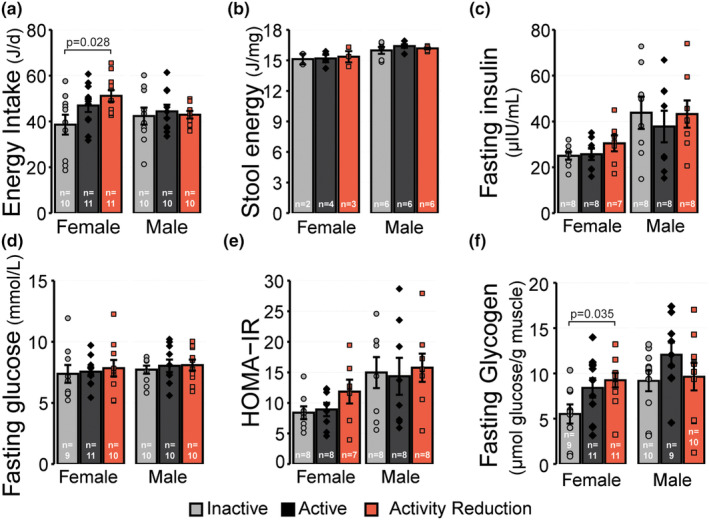
FIGURE 2.

Effect of activity reduction on energy intake, glucose homeostasis and muscle glycogen stores. (a) Average daily energy intake from food in the final week of the study period. (b) Energy content of stool. (c) Fasting plasma insulin and (d) blood glucose concentrations, and (e) HOMA‐IR. (f) Glycogen content of the quadriceps muscles. Values reported are the mean ± standard error with individual values overlaid. Data displayed were compared using one‐way ANOVA with Tukey tests where appropriate. The number of biological replicates in each experiment is indicated on each individual panel. Inactive group = light gray circles/bars, Active group = dark gray diamonds/bars, Activity Reduction group = red squares/bars.
