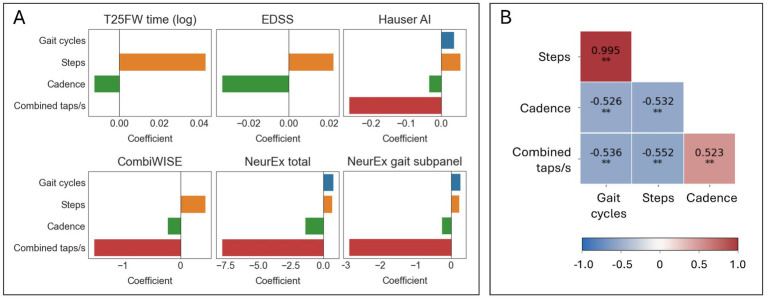
Figure 6.
Elastic net models selected diverse features for improved prediction of clinical scores. (A) Bar graphs summarizing which features were selected by elastic net models and their coefficients. (B). A Spearman’s ρ correlation matrix of the selected features in the training cohort (N = 102). *p ≤ 0.01 and **p ≤ 0.001.

