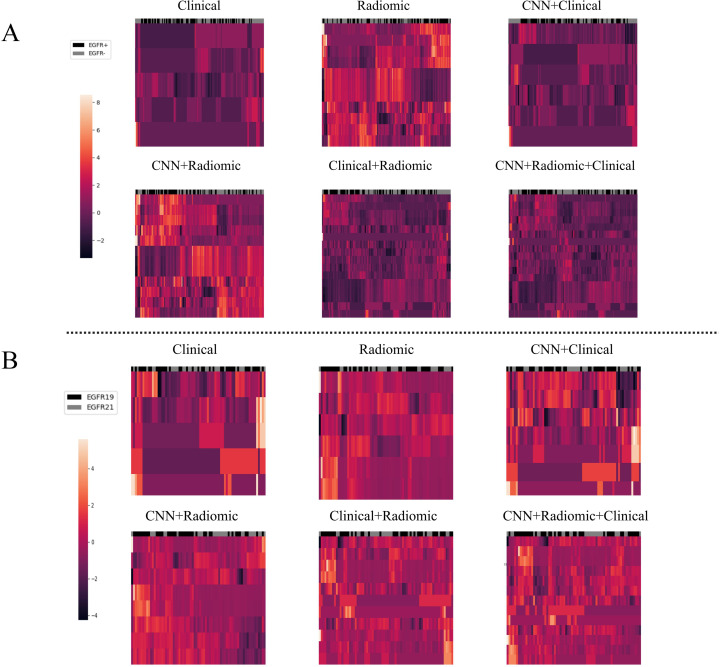
Figure 6.
The clustering relationship of different models based on various features. (A) In the task of predicting EGFR mutations, the x-axis represents 147 nodules from the test set, and the y-axis represents the features of different models such as Modelclinical, Modelradiomic, ModelCNN+clinical, ModelCNN+radiomic, Modelradiomic+clinical, and ModelCNN+radiomic+clinical. Each feature has been normalized. Nodules in the same cluster (adjacent columns) have similar radiomic characteristics in Euclidean space. The black gray bar indicates the semantic tag EGFR +/- for each nodule. (B) In the task of distinguishing ex19del and L858R, the x-axis represents 71 nodules from the test set, and the y-axis represents the features of the different models. Again, each feature has been normalized. Nodules in the same cluster have similar radiomic characteristics, and the black gray bar indicates the semantic label EGFR ex19del/EGFRL858R for each nodule.

