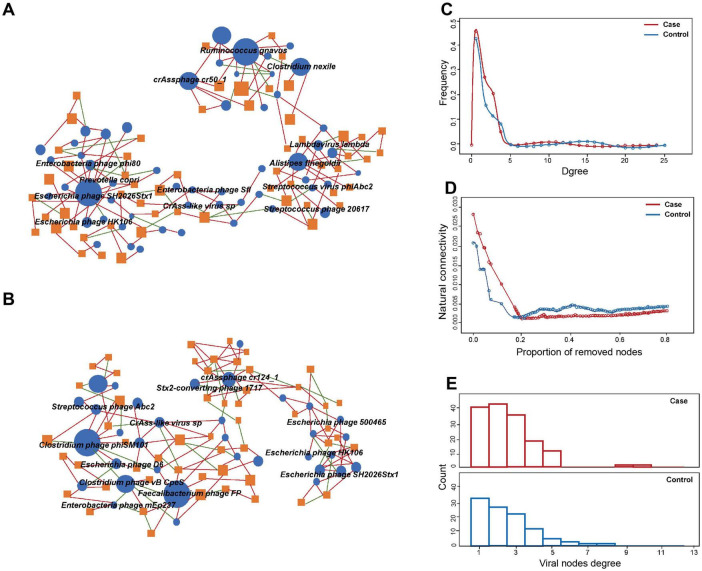
FIGURE 3.
Comparison of virus-bacteria co-occurrence networks between two groups. Virus-bacteria co-occurrence networks for panels (A) case and (B) control groups. The nodes are viruses and bacterial species. Blue ellipses and orange rectangles represent viruses and bacteria, respectively. Edges represent positive associations (red) and negative associations (green) between virus and bacteria at the species level. (C) Degrees of distribution of virus-bacteria co-occurrence networks. (D) Alternations of virus-bacteria co-occurrence networks based on the proportion of removed modes. (E) Degrees of viral nodes degree in virus-bacteria co-occurrence networks.

