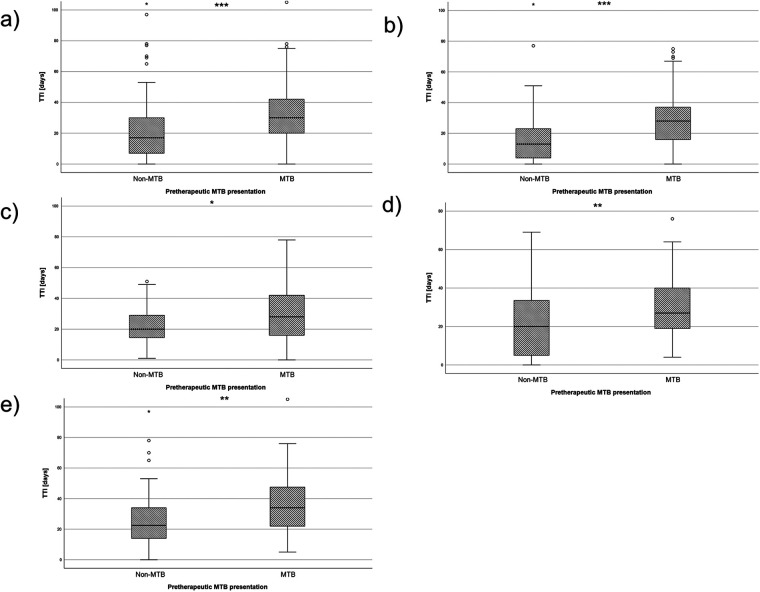
Figure 3.
Box plots depicting the TTI for the two groups of MTB and non-MTB presentation. (a) shows the TTI of the whole cohort, (b) shows the TTI of all UICC I patients, (c) shows the TTI of all UICC II patients, (d) shows the TTI of all UICC III patients and (e) shows the TTI of all UICC IV patients. NS, not significant, * = p < 0.05, ** = p < 0.01, *** = p < 0.001.

