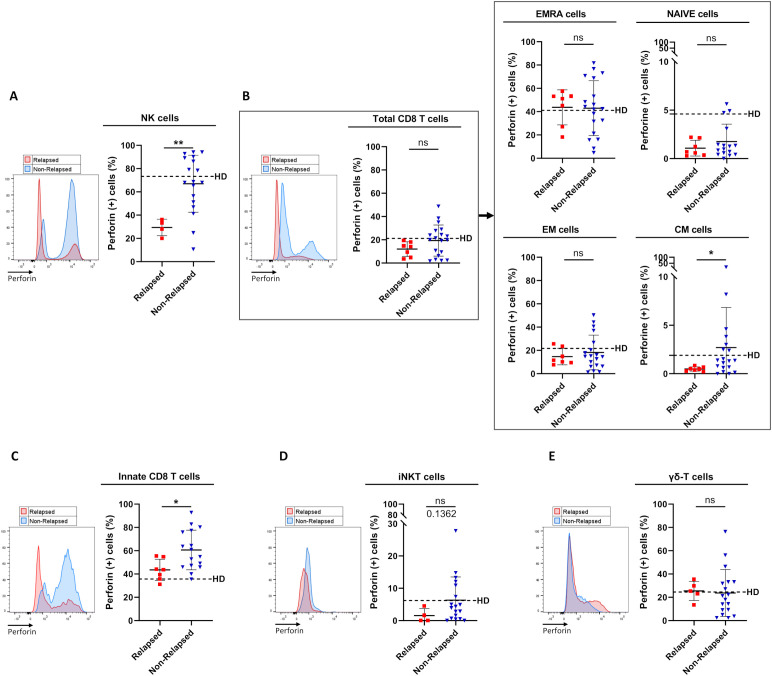
Figure 2.
Frequencies of perforin-expressing cells among circulating immune effector subsets between relapsed and non-relapsed patients at the moment of TKI discontinuation. (A) Frequency of perforin-expressing cells among NK cells, defined as CD3(-)CD56(+) cells, from relapsed (n=4) and non-relapsed (n=18) patients. Healthy control donors (HD) mean: 73.3% ± 16.3% (n=11). Of note, differences were significant between HD and relapsed patients (p-value: 0.0015). (B) Frequency of perforin-expressing cells among total CD8 T-cells, defined as TCR-αβ(+)CD8(+) cells (left panel), and among EMRA, Naive, EM, and CM cells based on the expression of CD45RA and/or CCR7 (right panel) from relapsed (n=7) and non-relapsed (n=19) patients. HD means: 21.2% ± 20.6% of total CD8 T-cells; 41.1% ± 24.9% of EMRA cells; 4.6% ± 7.2% of Naive cells; 21.7% ± 19.4% of EM cells; 1.9% ± 2.5% of CM cells (n=11). Of note, for CM cells, differences were significant between HD and relapsed patients (p-value: 0.0441). (C) Frequency of perforin-expressing cells among innate CD8 T-cells, defined as TCR-αβ(+)CD8(+)Eomes(+)KIR/NKG2A(+), from relapsed (n=7) and non-relapsed (n=16) patients. HD mean: 35.7% ± 14.5% (n=10). Of note, differences were significant between HD and non-relapsed patients (p-value: 0.0015). (D) Frequency of perforin-expressing cells among iNKT cells, defined as CD3(+)TCR-Vα24-Jα18(+), from relapsed (n=4) and non-relapsed (n=18) patients. HD mean: 6.2% ± 10.3% (n=11). (E) Frequency of perforin-expressing cells among γδ T-cells, defined as CD3(+)TCR-pan-γδ(+), from relapsed (n=5) and non-relapsed (n=18) patients. HD mean: 24.5% ± 17.9% (n=11). Representative overlays flow cytometry histograms show perforin expression in the different populations of interest in relapsed (red line) and non-relapsed (blue line) patients. Histograms represent cohort analysis of relative population frequencies (mean ± SD). Each dot represents a relapsed (red squares) or a non-relapsed (blue triangles) patient. Dotted lines represent frequency mean of perforin-expressing cells for each population of interest in HD. Statistical significance was determined by the two-tailed Mann-Whitney non-parametric test, ns: not significant, *p < 0.05; **p < 0.01.

