Fig. 1.

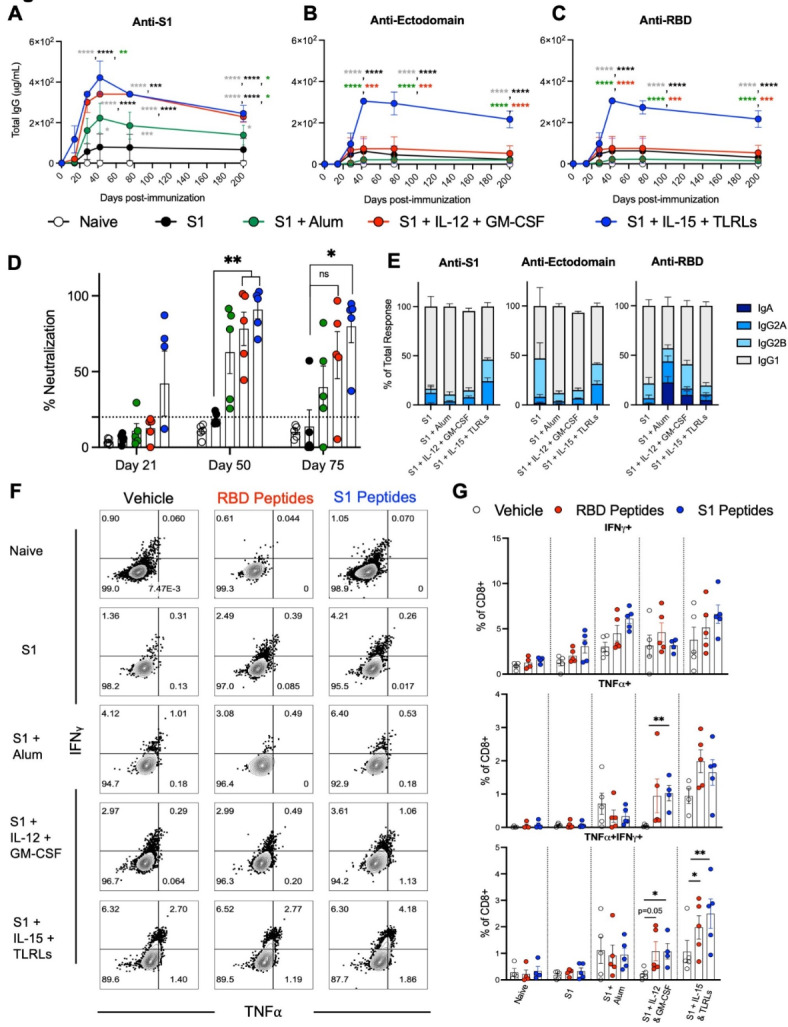
Cytokine and TLR-ligand adjuvant combination enhances the humoral and T cell immune response of S1 protein immunization. Immunization schedule: B6 (WT) mice were immunized with priming on day 0 and two booster doses, at two-week intervals. Mice were immunized with S1 protein alone (black) or co-delivered with Alum (green), IL-12 and GM-CSF (red), or IL-15 and TLR-Ls (blue) in DOTAP. Serum samples were collected at days 14, 28, 42, 75, and 200 post-immunization. Spleen cells were collected at day 200 post-immunization. Humoral immune responses were assessed following immunization by analysis of total serum IgG responses to (A) S1, (B) ectodomain, or (C) RBD of SARS-CoV-2 spike protein over time evaluated by ELISA. (D) Serum antibody neutralization potencies at days 21, 50, and 75 are presented as SNI% in 1:30 dilutions of sera against RBD-hACE2 binding. The dashed horizontal line corresponds to the lower limit of detection (LLOD = 20%) of the assay used. The data are represented as the mean ± SEM and represent at least two independent experiments. p values are shown for entirety of study using one (D) or two-way ANOVA (A-C) test with post hoc Tukey’s multiple comparisons; *, p < 0.05; **, p < 0.01; ***, p < 0.001; ****, p < 0.0001. (E) Day 45 post-immunization serum samples were subjected to ELISAs for S1, RBD, or ectodomain of spike protein reactivity and antibody isotypes were assessed and normalized to total antibody response. (F and G) Cellular immune responses were assessed at day 200 post-immunization by stimulating spleen cells ex vivo with either vehicle control or overlapping peptide pools comprising the RBD or S1 proteins, all peptides at 0.1 µg/ml, for 6 h and then assessed by flow cytometry for intracellular production of IFNγ and TNFα. (F) Representative flow cytometry contour plots and (G) graphed values of individual mice. *, p < 0.05; **, p < 0.01; ***, p < 0.001; ****, p < 0.0001 determined using a paired two-tailed Student’s t-test.
