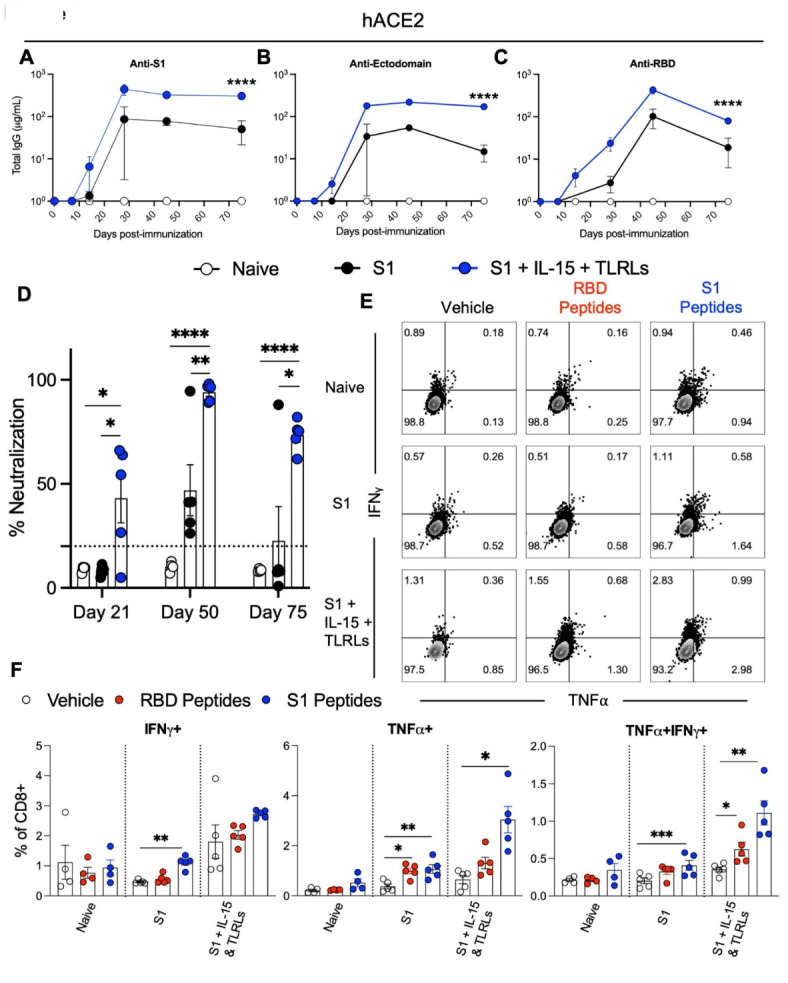
Fig. 3.

Immune response to adjuvanted S1 protein vaccine in hACE2 mice. K18-hACE2 [B6.Cg-Tg(K18-ACE2)2Prlmn/J] transgenic mice were immunized with S1 protein alone or S1 protein co-delivered with IL-15 and TLRLs. Serum samples were collected at days 14, 28, 45, and 75 post-immunization, and spleen cells were collected at day 200 post-immunization. Humoral immune responses were assessed following immunization by analysis of total serum IgG responses to (A) S1, (B) ectodomain, or (C) RBD of SARS-CoV-2 spike protein over time evaluated by ELISA. (D) Serum antibody neutralization potencies at days 21, 50, and 75 are presented as SNI% in 1:30 dilutions of sera against RBD-hACE2 binding. The dashed horizontal line corresponds to the lower limit of detection (LLOD = 20%) of the assay used. The data are represented as the mean ± SEM and represent at least two independent experiments. p values are shown for entirety of study using one (D) or two-way ANOVA (A-C) test with post hoc Tukey’s multiple comparisons; *, p < 0.05; **, p < 0.01; ***, p < 0.001; ****, p < 0.0001. Cellular immune responses were assessed at day 75 post-immunization by stimulating spleen cells ex vivo with either vehicle control or overlapping peptide pools comprising the RBD or S1 proteins, all peptides at 0.1 µg/ml, for 6 h and then assessed by flow cytometry for intracellular production of IFNγ and TNFα in CD8+ T cells. (E) Representative flow cytometry contour plots and (F) graphed values of individual mice. *, p < 0.05; **, p < 0.01; ***, p < 0.001; ****, p < 0.0001 determined using a paired two-tailed Student’s t-test.
