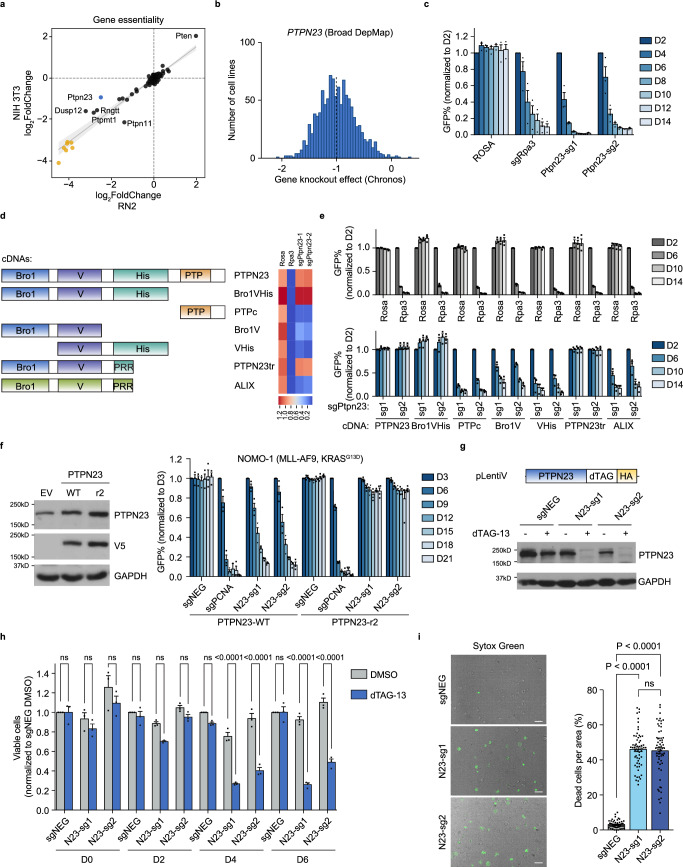
Fig. 1. PTPN23 was identified to be essential for cell survival with CRISPR screening.
a Gene essentiality of mouse PTPs in RN2 cells and NIH 3T3 cells. sgRNA frequencies at Day 2 and Day 14 were determined by next-generation sequencing, with average logarithmic frequency changes calculated. Yellow dots represent pan-essential genes spiked into the screen library. b Histogram of PTPN23 gene knockout effect in 1078 cancer cell lines (DepMap 22Q2). The dashed line indicates the median score. c GFP competition growth assays performed in RN2 cells (n = 3 independent experiments). d Left, Human PTPN23 and ALIX full-length constructs and PTPN23 truncations used in rescue experiments. Right, Heatmap visualizing the complementation effects aligned with the corresponding numbers on D14 in (e). His: His domain; PRR: Proline-rich region, located at the N-terminus of the His domain. e GFP competition growth assays performed in RN2 stable cell lines expressing indicated cDNAs. Top, control sgRNAs; bottom, PTPN23 sgRNAs (n = 3 independent experiments). f Left, immunoblot of NOMO-1 cells overexpressing empty vector (EV), sgRNA-sensitive (PTPN23-WT) or sgRNA-resistant (PTPN23-r2) PTPN23 cDNA (n = 3 independent experiments). Right, GFP competition growth assays performed using NOMO-1 stable cell lines expressing either PTPN23-WT (n = 3 independent experiments) or PTPN23-r2 (n = 4 independent experiments). g Top, acute depletion of PTPN23 with dTAG system. NOMO-1 cells stably expressing sgRNA-resistant PTPN23 fused with dTAG and endogenous PTPN23 were depleted with two sgRNAs. Bottom, immunoblotting analysis of PTPN23 examined after 4-day treatment of dTAG-13 (100 nM). h CellTiter-Glo (CTG) luminescence cell viability assay measured on cells treated with either DMSO or dTAG-13. DMSO or 500 nM dTAG-13 were added to three PTPN23-dTAG NOMO-1 cell lines established in (g) (n = 3 independent experiments). i Cell death indicated by Sytox Green positivity. PTPN23-dTAG NOMO-1 cells were treated with 200 nM dTAG-13 for 4 days, and stained with Sytox Green (n = 60 fields captured, 3 independent experiments). Scale bar: 30 μm. Data are presented as mean ± SEM, statistical analysis for (h) by Two-way ANOVA, Sidak’s multiple comparisons test; (i) by One-way ANOVA, Tukey’s multiple comparisons test.

