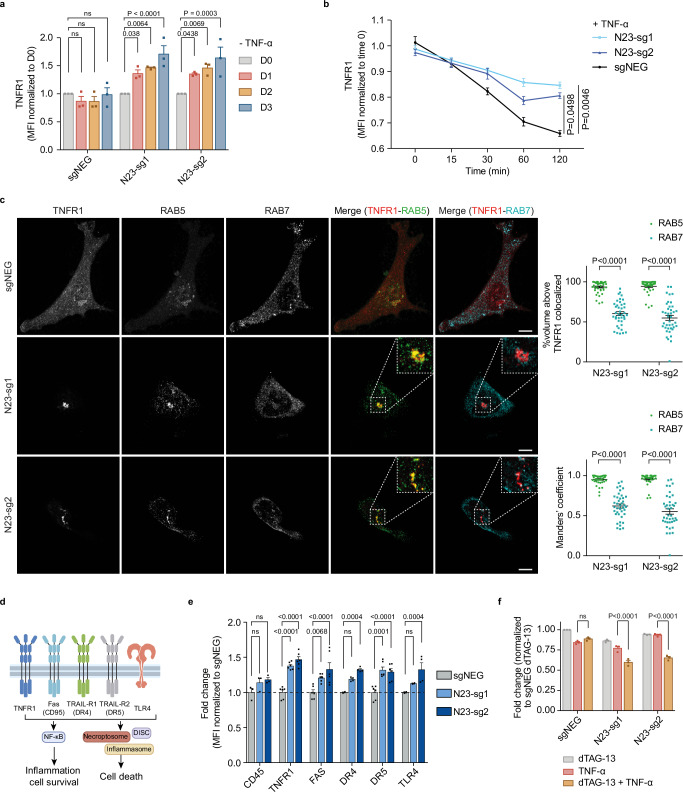
Fig. 3. PTPN23 controlled the spatiotemporal regulation of TNFR1.
a Quantitation of fold changes in endogenous TNFR1 in the presence or absence of PTPN23 normalized to negative control at day 0 (n = 3 independent experiments). PTPN23-dTAG NOMO-1 cells were treated with 200 nM dTAG-13 for indicated periods. b Flow cytometry analysis depicting total TNFR1 levels in PTPN23-dTAG NOMO-1 cells stimulated with 200 ng/ml FLAG-TNF-α for the indicated time. Prior to stimulation, cells were treated with 200 nM dTAG-13 for 2 days to degrade PTPN23-dTAG recombinant protein (n = 4 independent experiments). c Left, representative immunofluorescence images of TNFR1, RAB5 and RAB7 in the modified HeLa cells. Hela cells were engineered with tetracycline-responsive element (TRE)-Cas9, and then a vector containing TNFR1-mCherry and either negative control or PTPN23 sgRNAs was ectopically expressed. Cells were treated with 1 μg/ml doxycycline (Dox) for 5 days and depletion of PTPN23 was examined (Supplementary Fig. 3f). Insets are higher magnification views of dashed rectangular regions. Images are shown as 3D reconstructions from confocal image stacks. Scale bar: 10 μm. Top right, quantification of volume percentage of TNFR1 colocalized with RAB5 or RAB7 in PTPN23-deficient cells. Bottom right, Manders’ colocalization coefficients of TNFR1-RAB5 and TNFR1-RAB7 (n = 40 per group, 2 independent experiments). d Death receptors and TLR4 subjected to examination. Created with Adobe Illustrator and BioRender.com (License reference: https://BioRender.com/a17y329). e Fold changes of death receptors and TLR4 in PTPN23-dTAG NOMO-1 cells after 3 days of 200 nM dTAG-13 treatment measured by flow cytometry (n = 3 biological replicates for CD45, n = 4 for DR4 and TLR4, n = 6 for TNFR1, FAS and DR5). f Cytotoxicity of TNF-α in PTPN23-dTAG NOMO-1 cells. Cells were incubated with 1 μM dTAG-13 or 100 ng/ml TNF-α as indicated for 48 h, and cell viability was measured using CTG assay (n = 3 independent experiments). Data are presented as mean ± SEM. Statistical analysis for (a, b, e, and f) by two-way ANOVA, Tukey’s multiple comparisons test; (c) by two-way ANOVA, Sidak multiple comparisons test.

