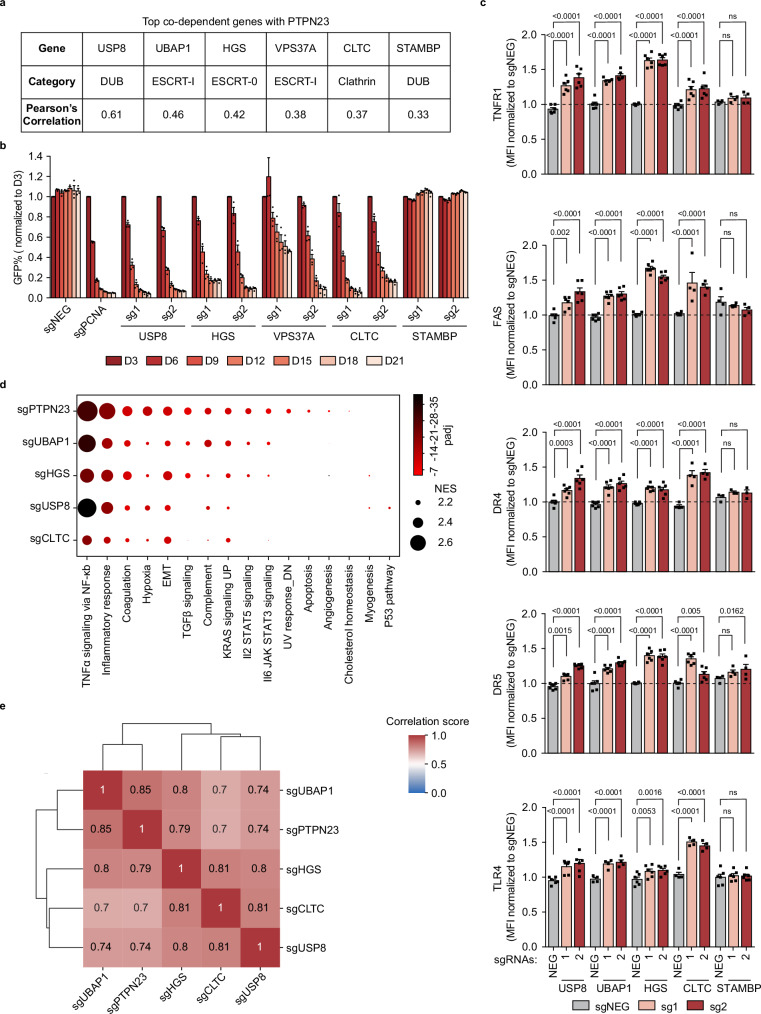
Fig. 5. ESCRT machinery is essential to limit cell death mediated by death receptors and TLRs.
a The list of PTPN23’s top co-dependent genes with correlation factor >0.3 from DepMap Portal (22Q4 Public dataset). b GFP competition growth assay of PTPN23’s co-dependent gene depletion in NOMO-1 cells (n = 3 independent experiments). c Flow cytometric measurements of death receptors and TLR4 in NOMO-1 cells. Receptor levels were measured at day 7 post-infection with sgRNAs against corresponding ESCRT components. The number of biological replicates (n) for each gene knockout (KO) and receptor measurement is as follows: USP8 KO (n = 6), UBAP1 KO (n = 6, except for TLR4 measurement, n = 4), HGS KO (n = 6), CLTC KO (n = 4, except for TNFR1 and DR5 measurements, n = 6), and STAMBP KO (n = 4, except for DR4 measurement, n = 3, and TLR4 measurement, n = 6). d Dot plot of enriched pathways with normalized enrichment score (NES) > 2 derived from GSEA analysis. The sizes of the dots correspond the NES, and the colors of the dots represent the -log10 (padj). The NES is calculated by normalizing the raw enrichment score to account for differences in gene set sizes. The adjusted p-value (padj) is computed to control the false discovery rate when comparing multiple datasets. EMT: epithelial-mesenchymal transition. e Global correlation matrix of gene expression profile changes between samples. The log2 fold changes were calculated for each gene to compare the knockout and negative control samples. Heatmap represents Pearson’s correlation coefficient for log2 (fold changes) across five genes. NOMO-1 cells were transfected with two independent sgRNAs targeting the indicated gene, harvested at day 5 post-infection for USP8 and day 6 for remaining samples (n = 3 biological replicates). Data are presented as mean ± SEM. Statistical analysis for (c) by two-way ANOVA, Dunnett’s multiple comparisons test.

