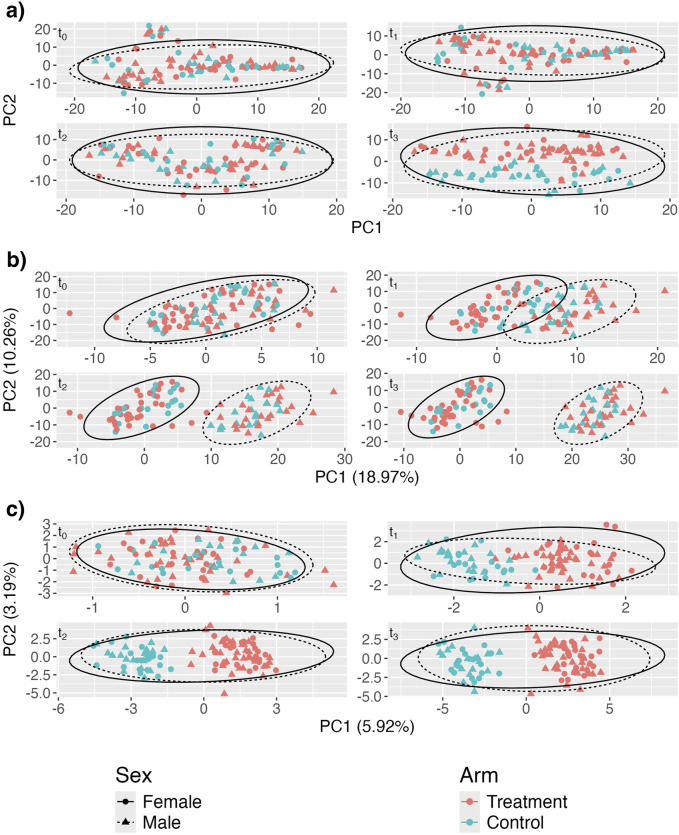
FIGURE 2.
Adjusted principal coordinates analysis (aPCoA) plots of a simulated longitudinal dataset where a time-invariant covariate (sex) obscures the treatment effect ( and ). (A) aPCoA approach for cross-sectional data, adjusting for sex in a linear model, with data stratified by time point; (B) aPCoA approach adjusting only for sex in a linear model across all time points; (C) proposed aPCoA approach for repeated measures, adjusting for sex, time, and their interaction as fixed effects, while including a per-subject random intercept as a random effect in a linear mixed model. Points are colored by treatment arm and shaped by sex.

