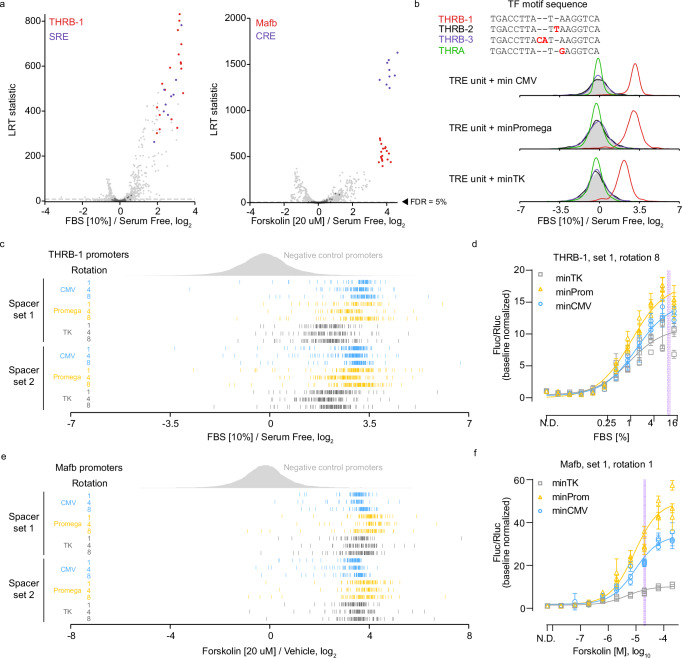
Fig. 2. TRE-MPRA benchmarking with fetal bovine serum and forskolin.
a Promoter responses of HEK293 cells treated with 10% FBS (left) or 20 µM forskolin (right) (n = 3 each) compared to untreated cells (n = 4). Select promoters are colored by TFBM. Dashed lines: 5% FDR threshold. Dark gray data points: negative control promoters. LRT, likelihood ratio test. b Barcode fold changes for promoters containing the THRB-1 motif or similar motifs following 10% FBS treatment. Individual barcode responses of each THRB-1 (c) or Mafb (e) promoter in FBS or forskolin treated cells, respectively, relative to controls. d, f Dose-response curves of THRB-1 (d) and Mafb (e) TRE promoters tested in dual-luciferase assays. Data were scaled to the Fluc/Rluc ratio in untreated cells (N.D. – no drug). Data points and error bars: mean and standard deviation (n = 4 technical replicates) within each experimental replicate (n = 3 independent experiments). Shaded lines indicate TRE-MPRA doses.

