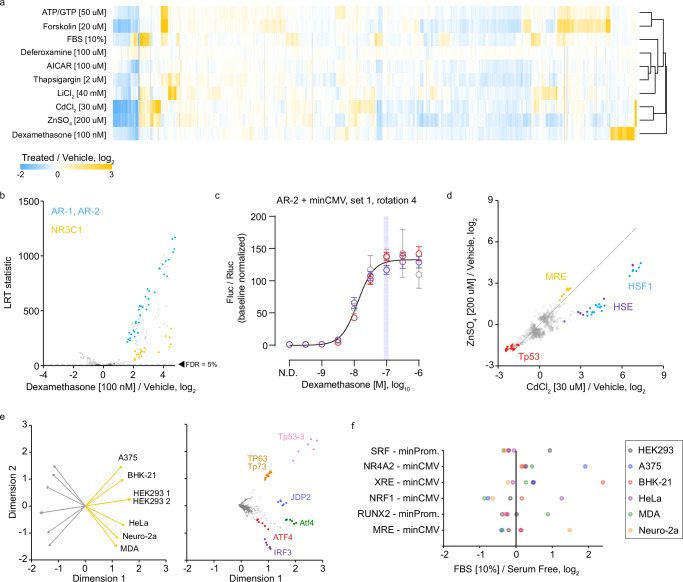
Fig. 3. TRE-MPRA results using additional stimuli.
a Heatmap of fold change responses in HEK293 cells across ten stimulus conditions relative to untreated cells. Treatment conditions were clustered using Euclidean distance with complete linkage. Displayed are the fold change values for all promoters that were significantly altered by treatment in at minimum one comparison. b Volcano plot of promoter responses following treatment of HEK293 cells with 100 nM dexamethasone in comparison to untreated cells. Dashed line indicates an FDR threshold of 5%. Negative control promoters are indicated by dark gray data points. c Dose response curve from HEK293 cells transfected with an AR promoter dual luciferase reporter and treated with dexamethasone (AR, minCMV, rotation 4, spacer set 1). Data were scaled (baseline normalized) to the Fluc/Rluc ratio in untreated cells (N.D. – no drug). The curve was fit to baseline normalized Fluc/Rluc values. Data points and error bars indicate the mean and standard deviation of technical replicates within each of three experimental replicates (n = 3 independent experiments, distinguished via color). The shaded vertical line indicates the dose of dexamethasone used in the TRE-MPRA experiment. d Scatterplot comparing promoter responses between lithium and cadmium treatments. HSF1 units were more responsive to cadmium. Dashed line indicates the identity line (y = x). e Separated biplots of standardized baseline transcription rates in the six mammalian cell lines. Displayed are the untreated cell line (left) and promoter (right) projections across two dimensions. All colored units are paired with the minCMV promoter. Orange and gray projection lines indicate the positive and negative directions of the treatment projection, respectively. f Example cell line-specific promoters responsive to treatment with 10% FBS. Each displayed promoter was significantly induced by FBS treatment in exactly one of six mammalian cell lines (FDR < 5%).

