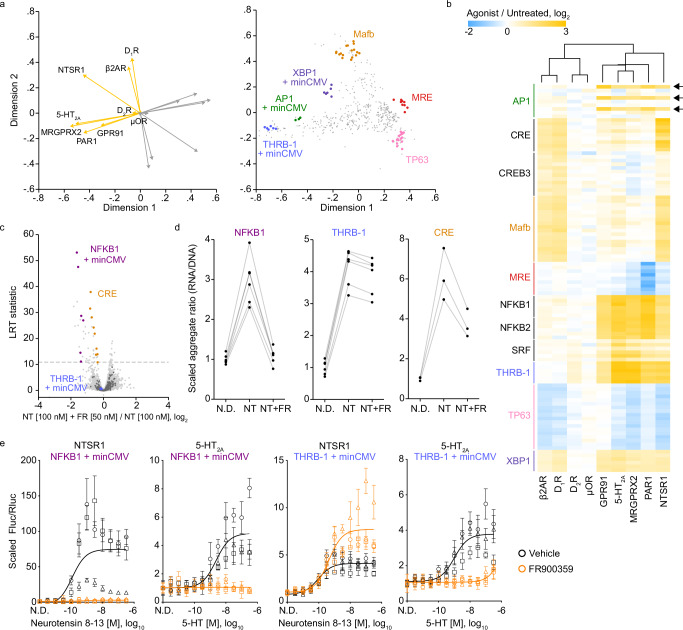
Fig. 5. Profiling promoter activity following activation of additional GPCRs.
a Separated biplots for the set of promoters that showed a significant response to receptor agonism in at least one of the nine datasets. Displayed are the GPCR log2 fold changes (agonist versus untreated) (left) and promoter (right) projections across two dimensions. Responding promoters of interest are highlighted. Orange and gray projection lines indicate the positive and negative directions of the treatment projection, respectively. b Heatmap of selected promoter responses to agonism across GPCR experiment groups. GPCRs were clustered using Euclidean distance with complete linkage. Arrows indicate the AP1 unit/minCMV promoters. A list of promoter (row) labels can be found in Supplementary Data 6. c Volcano plot of promoter responses following neurotensin 8−13 (NT) treatment in HEK293 cells co-transfected with the TRE-MPRA library and an NTSR1 expression plasmid, with or without addition of the Gαq-specific inhibitor FR900359 (FR). d Scaled transcription rate estimates (aggregate ratios) for NFKB1, THRB-1, and CRE units paired with minCMV in HEK293 cells expressing NTSR1. N.D., no drug; NT, neurotensin 8−13 [100 nM]; NT + FR, neurotensin 8−13 [100 nM] + FR900359 [50 nM]. Each set of connect dots represents a single promoter. e Dual luciferase response curves in HEK293 cells in the presence or absence of 50 nM of the Gαq-specific inhibitor FR900359 (THRB-1, minCMV, rotation 8, spacer set 1; NFKB1, minCMV, rotation 8, spacer set 1). Data were scaled (baseline normalized) to the Fluc/Rluc ratio in untreated cells (N.D. – no drug). The curve was fit to baseline normalized Fluc/Rluc values across three experimental replicates. Data points and error bars indicate the mean and standard deviation of four technical replicates within each of three experimental replicates (n = 3 independent experiments, distinguished via shape).

