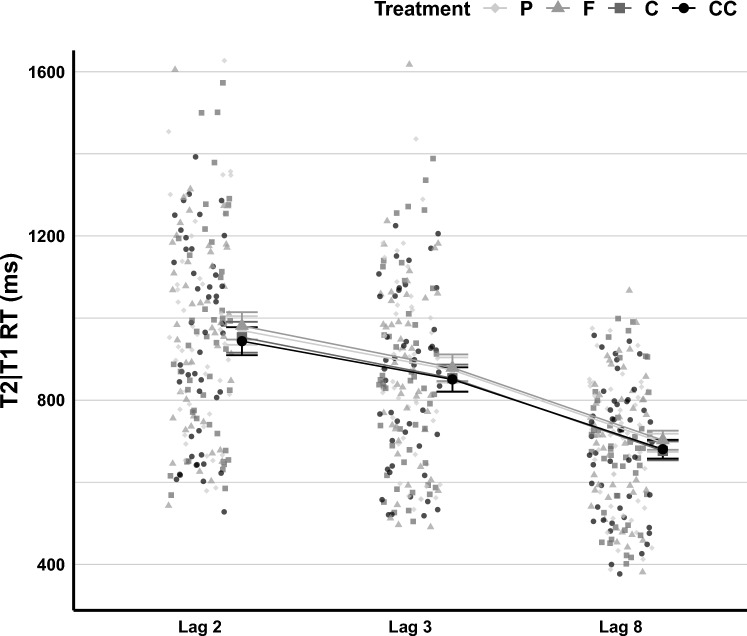
Fig. 4.
T2|T1 RT in the RSVP Task across Treatment and Lag. The figure illustrates individual RT means across various treatment conditions. The Placebo (P) condition is represented by light grey filled diamonds for both individual data points and larger dots indicating means and standard errors. The cocoa flavanols (F) condition is signified by medium-light grey filled triangles. The caffeine (C) condition is depicted using medium-dark grey filled squares. Lastly, the concurrent (CC) condition, which combined cocoa flavanols and caffeine, is represented by black filled circles

