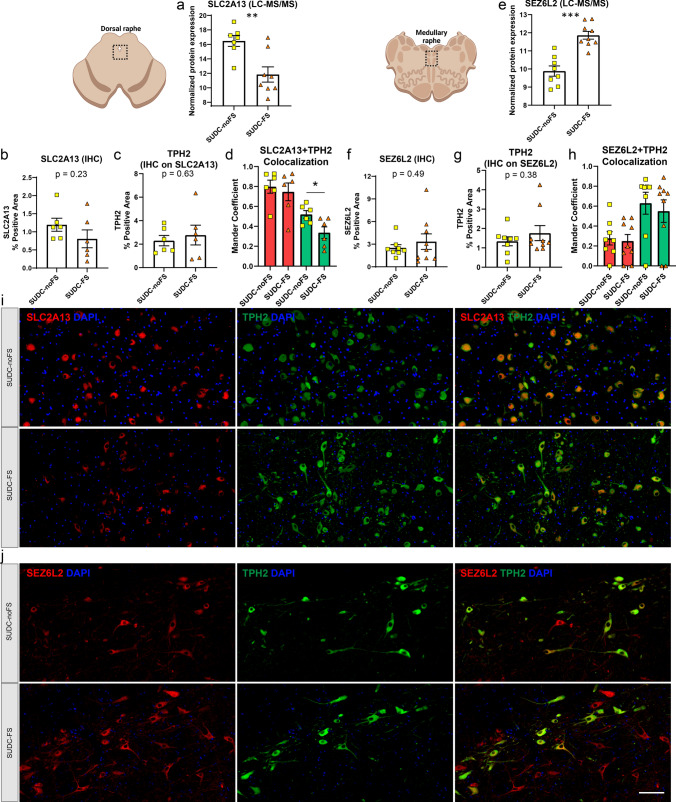
Fig. 4.
Histological localization and quantification of top protein candidates SLC2A13 and SEZ6L2 in the brainstem. a By LC–MS/MS in the midbrain dorsal raphe, SLC2A13 was among the top significant proteins and had the largest fold change with a 24.9-fold decrease in SUDC-FS when compared to SUDC-noFS (p = 3.97 × 10⁻³), b IF for SLC2A13 in the midbrain dorsal raphe showed a similar trend with a 1.5-fold decrease in SUDC-FS (p = 0.23) from semiquantitative analysis, c IF for TPH2 on the same slides for SLC2A13 in the midbrain dorsal raphe showed no difference between SUDC-FS and SUDC-noFS, similar to proteomics, d colocalization analysis of SLC2A13 and TPH2 in the midbrain dorsal raphe showed a moderate correlation by Mander coefficient of the green channel (TPH2), which was different between SUDC-FS and SUDC-noFS (p = 0.026). There was a higher correlation in the red channel (SLC2A13) for both SUDC-FS and SUDC-noFS. e By LC–MS/MS in the medullary raphe, SEZ6L2 was among the top significant proteins and had the largest fold change with a 3.9-fold increase in SUDC-FS (p = 4.75 × 10⁻⁵), f IF for SEZ6L2 in the medullary raphe showed a similar trend with a 1.3-fold increase (p = 0.49) from semiquantitative analysis, g IF for TPH2 on the same slides for SEZ6L2 in the medullary raphe showed no difference between SUDC-FS and SUDC-noFS, similar to proteomics, h colocalization analysis of SEZ6L2 and TPH2 in the medullary raphe showed a low correlation in the red channel and moderate correlation in the green channel, which was not different between SUDC-FS and SUDC-noFS, i representative images from IF in the midbrain dorsal raphe are shown for SLC2A13 (red) and TPH2 (green) in SUDC-FS and SUDC-noFS. TPH2 indicates the region with serotonergic neurons that was microdissected for proteomic analysis. SLC2A13 was present in TPH2( +) cells, as well as in other neighboring TPH2(−) cells, j representative images from IF in the medullary raphe are shown for SEZ6L2 (red) and TPH2 (green) in SUDC-FS and SUDC-noFS. TPH2 indicates the region with serotonergic neurons that was microdissected for proteomic analysis. SEZ6L2 was present in TPH2( +) cells, as well as in other neighboring TPH2(−) cells. Scale bar 100 um. Error bars indicate SEM

