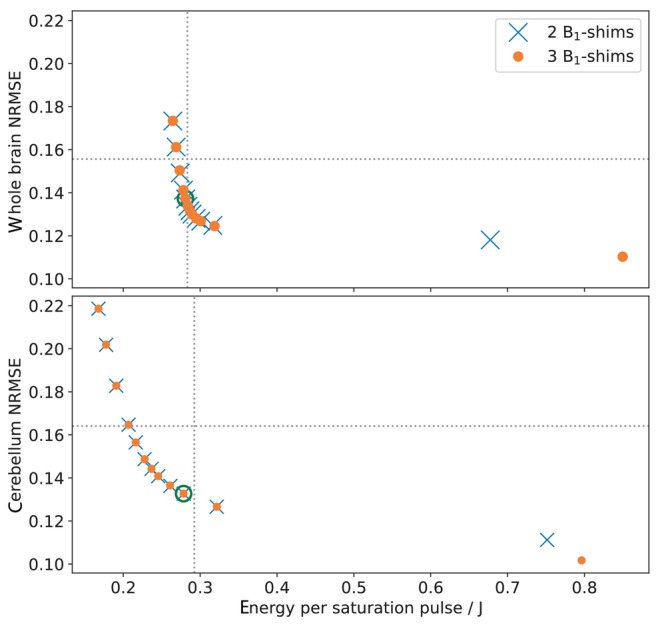
FIGURE 2.

PUlse design for Saturation Homogeneity utilizing Universal Pulses (PUSHUP) pulses have been calculated with a whole‐brain mask (top) and a cerebellum mask (bottom) with two ‐shims (blue) and three ‐shims (orange) using different . For each pulse, the normalized root‐mean‐square error (NRMSE) of and the pulse energy was calculated. decreases from left to right. The dotted lines represent the MIMOSA values when scaled to whole‐brain and cerebellum maps, respectively. The green circle mark the pulses which are used in this work. These are the pulses with the most homogeneous distribution, which are less SAR intense than MIMOSA.
