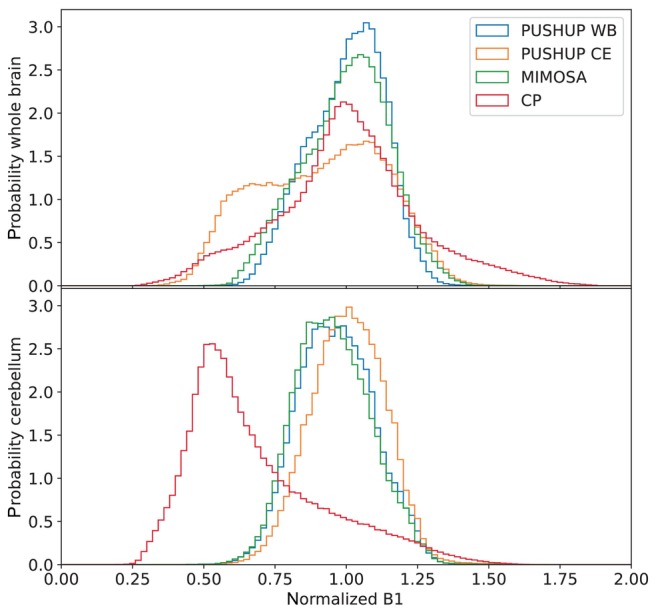
FIGURE 3.

Histograms of the distributions, normalized to the target , of the different saturation modules and MIMOSA for comparison. Data from all subjects were merged. The top plot shows the distributions in the whole brain and the bottom plot shows the cerebellar distributions.
