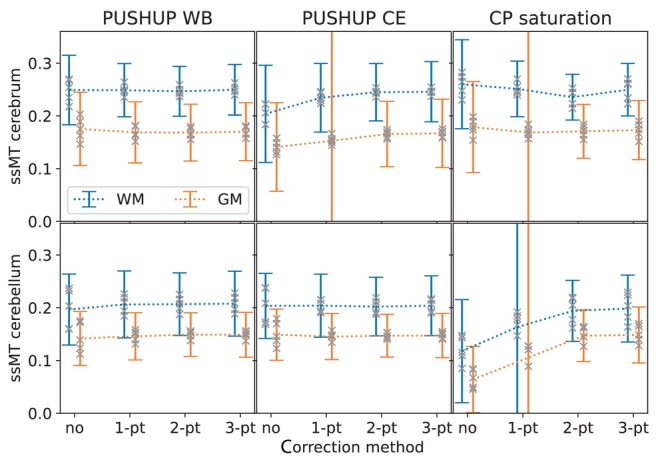
FIGURE 6.

Group mean and SD of the measured semisolid magnetization transfer (ssMT) amplitude within white matter (blue) and gray matter (orange) masks in the cerebrum (top) and the cerebellum (bottom) for the four ‐correction methods. This is shown for PUSHUP‐WB (left) PUSHUP‐CE (middle) and CP saturation (right). The gray crosses mark the single‐subject mean values.
