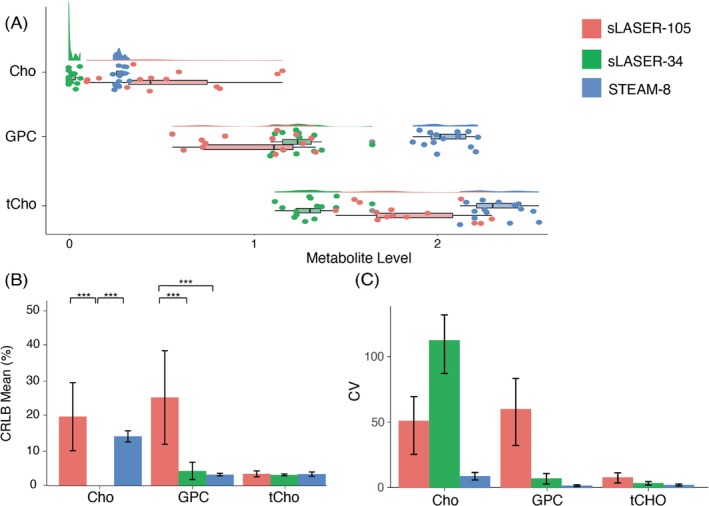
FIGURE 5.

(A) Mean and spread of choline (Cho), glycerophosphocholine (GPC) and total choline (tCho; Cho + phosphocholine (PC) + GPC) data for each sequence. (B) Mean Cramér‐Rao lower bound (CRLB) values for Cho, GPC, and tCho, error bars represent SD. Mean Cho CRLB for sLASER‐34 not shown as > 500 (C) Coefficient of variation (CV) values for Cho, GPC and tCho, error bars represent 95% confidence intervals calculated using bootstrap resampling. *p < 0.05, **p < 0.01, ***p < 0.001. sLASER‐34, semi‐LASER, TE = 34 ms; sLASER‐105, semi‐LASER, TE = 105 ms; STEAM‐8, stimulated echo acquisition mode, TE = 8 ms.
