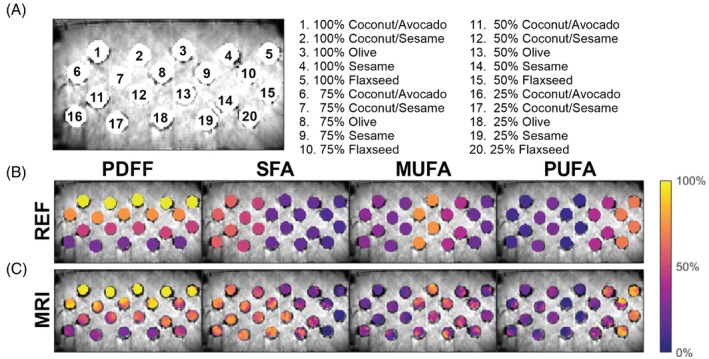
FIGURE 3.

(A) Oil emulsion phantom layout; (B) synthetic parameter maps depicting the FAC reference values; and (C) MRI‐measured FAC maps of the oil emulsion phantom used for validation. SFA, MUFA, PUFA, and PDFF maps are plotted as colormaps over the combined water and fat magnitude image. FAC, fatty acid composition; MUFA, monounsaturated fatty acid; PDFF, proton density fat fraction; PUFA, polyunsaturated fatty acid; SFA, saturated fatty acid.
