
FIGURE 7.
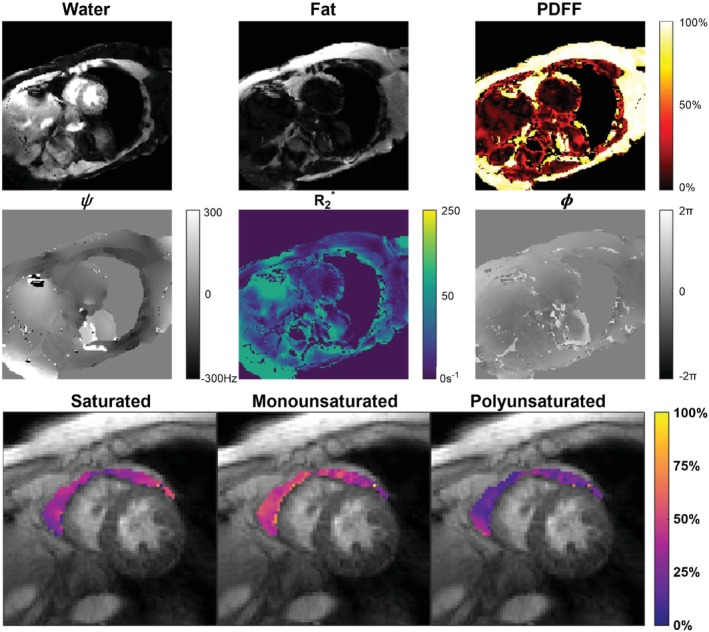
Images of a midventricular short‐axis slice taken from a representative STEMI patient. Shown are images of the water component and total fat component , as well as maps of PDFF, , and . EAT FAC maps of the SFA, MUFA, and PUFA are displayed. The EAT region was manually contoured, and the GRE magnitude image at the first TE is used as the background.