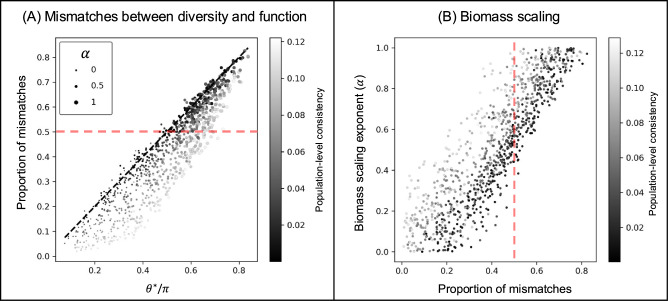
Fig. 4. Mismatches between functions and diversity in their responses to perturbations can be related to the biomass scaling of those perturbations.
A The angle between total biomass and the gradient of a diversity index (here q = 2) predicts the proportion of mismatches between them. Specifically, the relevant angle is between total biomass and the gradient of diversity after they have been scaled by the biomass of each species (θ*). When perturbations are scaled by species biomass (scaling exponent α > 0) total biomass and diversity can effectively become opposite functions. Points above the dashed red line showcase where there is a systematic mismatch in the observations of total biomass and diversity. B How much a perturbation is scaled by biomass can be estimated from the proportion of mismatches between function and diversity.

