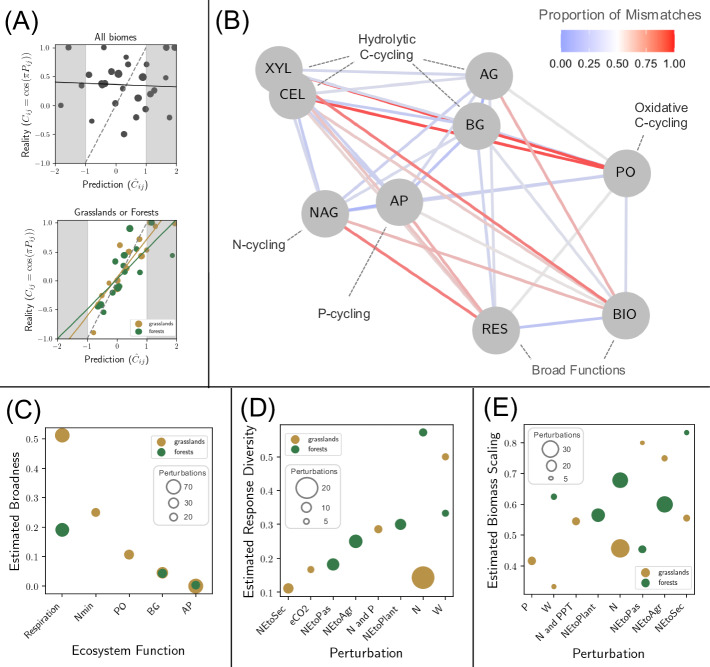
Fig. 5. Reanalysis of the empirical data.
A Results of the validation test, formally described in Supplementary Note 2, for the entire dataset (top) and for the grasslands data in orange and forest data in green (bottom). B Force-directed network constructed with the Kamada–Kawai path-length cost-function using the matrix of mismatches from the grasslands dataset as the adjacency matrix. The colour of the edges corresponds to the proportion of mismatches. The functions are microbial respiration (“RES”'), microbial biomass (“BIO”), phenol oxidase (“PO”), α-1,4-glucosidase (“AG”), β-1,4-glucosidase (“BG”), cellobiohydrolase (“CEL”), β-1,4-xylosidase (“XYL”), N-acetyl-β-glucosaminidase (“NAG”), and phosphatase (“AP”). C Estimates for the broadness based on mismatches between total biomass for five functions: microbial respiration, net N mineralization rate, phenol oxidase (“PO”), β-1,4-xylosidase (“XYL”), and phosphatase (“AP”). The size of the points corresponds to the number of observations that the proportion of mismatches is based on. D Estimates for the response diversity of perturbations based on the mismatches between total biomass and respiration (two functions with many shared observations). E Estimates for the biomass scaling of perturbations based on the mismatches between total biomass and Shannon diversity (the function and diversity metric with most shared observations). For parts (D, E) the size of the points corresponds to the number of observations and the perturbations are: elevated carbon dioxide (“eCO2”), nitrogen addition (“N”), phosphorus addition (“P”), warming (“W”), elevated precipitation (“PPT”), and the conversion of native ecosystems to secondary ecosystems (“NEtoSec”), to pasture (“NEtoPas”), to plantations (“NEtoPlant”), or to agriculture (“NEtoAgr”).

