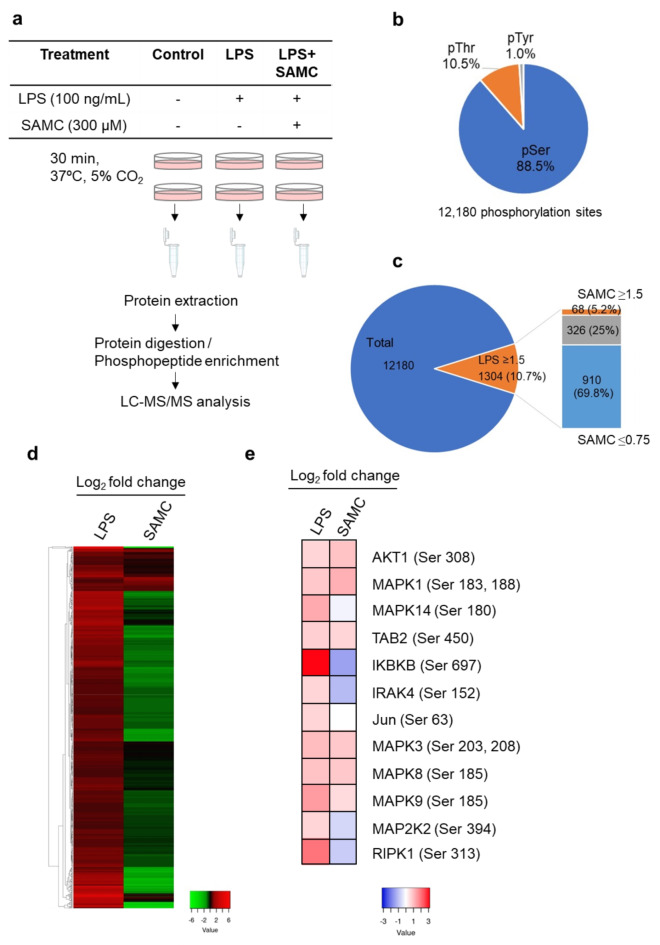
Fig. 2.
Effects of S-allylmercaptocysteine (SAMC) on phosphoproteome in HC11 cells treated with lipopolysaccharide (LPS). (a) Workflow of phosphoproteomic analysis. (b) The proportion of phosphorylated amino acid residues in detected phosphopeptides (pSer = phosphorylated serine, pThr = phosphorylated threonine, pTyr = phosphorylated tyrosine). (c) The proportion of phosphopeptides increased by LPS stimulation (≥ 1.5-fold, 10.7%) and the proportions of these phosphopeptides increased (≥ 1.5-fold, 5.2%) or decreased (≤ 0.75-fold, 69.8%) by SAMC treatment. (d, e) The heat map of the phosphopeptides affected by LPS and SAMC in Fig. 2c (d) and the phosphorylation level of protein kinases in the TLR signaling pathway (e). LPS and SAMC columns show the log2 fold changes of the phosphopeptide abundance in LPS-treated cells vs. control and in LPS- and SAMC- treated cells vs. LPS alone-treated cells, respectively.

