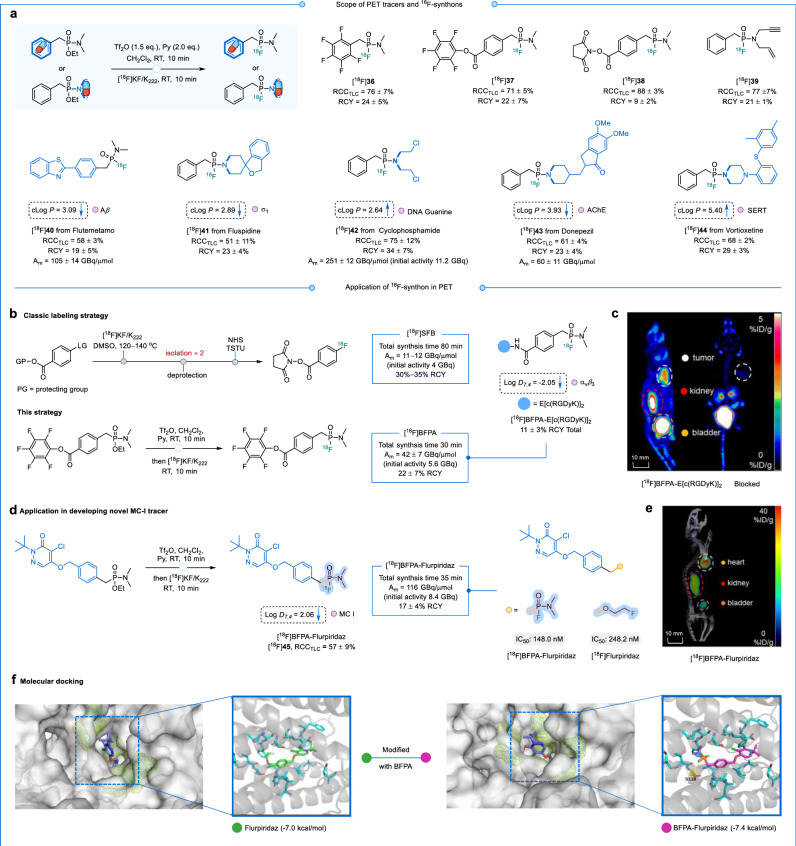
Fig. 6. PET tracers and 18F-synthons synthesized by late-stage radiofluorination of alkyl phosphonates.
a Late-stage radiofluorination of PET tracers and 18F-synthons. RCCTLC determined by radio-TLC (n = 3); RCY = isolated 18F-product activity amount/starting amount of radioactivity (decay corrected). cLog P values were predicted using ALOGPS 2.1 (http://www.vcclab.org/lab/alogps). Blue arrows pointing upward indicate an increase in cLog P/Log D7.4 compared to the parent compound, while downward arrows indicate a decrease. The small pink ball after cLog P/Log D7.4 represents the target of the parent compound. b Preparation αvβ3 integrin receptor developer [18F]BFPA-E[c(RGDyK)]2. c MicroPET images of [18F]BFPA-E[c(RGDyK)]2 in U87MG xenograft mice at 30 min after tail vein injection. 200 μg of E[c(RGDyK)]2 was used to block the tumor uptake of [18F]BFPA-E[c(RGDyK)]2. The white circle is the tumor area. d Preparation of PET tracer [18F]BFPA-Flurpiridaz targeting MC I. e MicroPET/CT images of healthy mice [18F]BFPA-Flurpiridaz 60 min after caudal vein injection. f Molecular Docking. Flurpiridaz and BFPA-Flurpiridaz to MC I (PDB: 7ZM8). Cyan: residues composing the substrate-binding cavity; yellow: residues forming hydrogen bonds; yellow dashed lines: locations of hydrogen bond.

