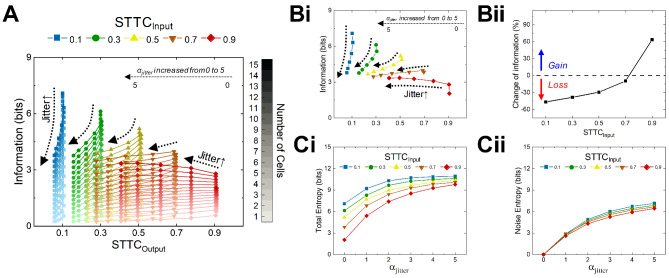
Fig. 6.
Jitter increases both total and noise entropy and results positive impact to increase information rate at relatively homogenous neurons in the analysis population. (A) Population information as a function of STTCOutput with different jitter with αjitter ranging from 0 to 5 for STTCsInput of 0.1, 0.3, 0.5, 0.7, and 0.9 (shown at top with different colors). For each plot in the same color, different tint levels indicate various network sizes; the darkest and the lightest (i.e., top and bottom) curves are for n = 15 and n = 1, respectively. (Bi) Same as A but for n = 15 only. (Bii) Change of information after introducing αjitter of 5: 1-[(information rate with jitters)/(information rate without jitters)] was plotted for STTCsInput. Data points above/below the dashed horizontal line indicate gain/loss in information by the added jitter. (Ci) Total and (Cii) noise entropy as a function of αjitter ranging from 0 to 5 for STTCsInput of 0.1, 0.3, 0.5, 0.7, and 0.9.

