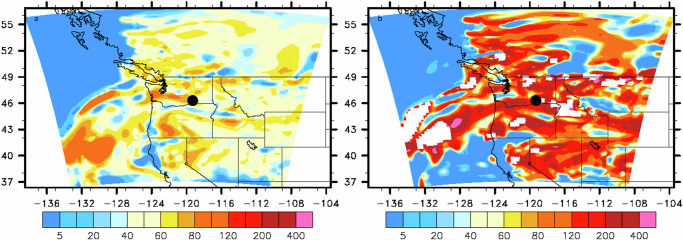
Fig. 3. WRF-Chem simulation for columnar absorption aerosol optical depth (AAOD) percentage differences.
a Percentage difference between Scenario 1 (RI from this study) and Scenario 2 (RI from AERONET) ([AAODscenario1-AAODscenario2]/AAODscenario1*100) and that between (b) Scenario 1 and Scenario 3 (using RI from Alexander et al.18) ([AAODscenario3-AAODscenario1]/ AAODscenario1*100) on August 14, 2018, averaged over 19:00–23:00 UTC. Markers represent the sampling site (46.3°N, 119.3°W). Color bars represent percentage differences. White area (b) is AAOD ratio greater than 500% for visual clarity.

