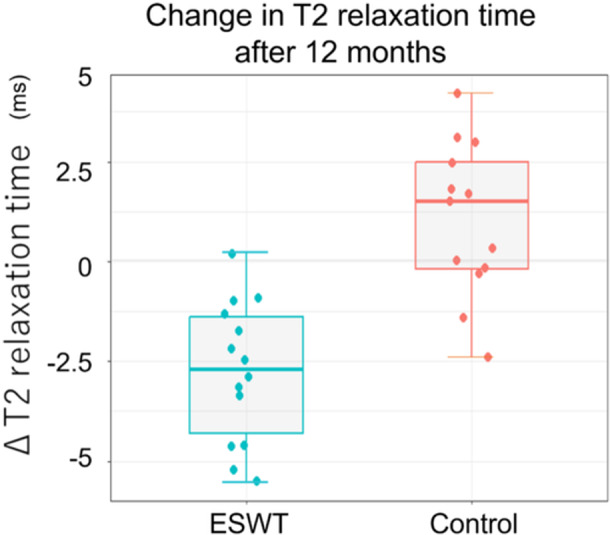
Figure 3.

Change in T2 relaxation time after 12 months. Graph showing the box and whisker plot in T2 relaxation time for magnetic resonance imaging T2 mapping 12 months after intervention. The ESWT group had a significantly greater reduction in T2 relaxation time than the control group at 12 months (ESWT group −2.9 ± 1.7 ms vs. control group 1.0 ± 1.9 ms; p < 0.001). ESWT, extracorporeal shockwave therapy.
