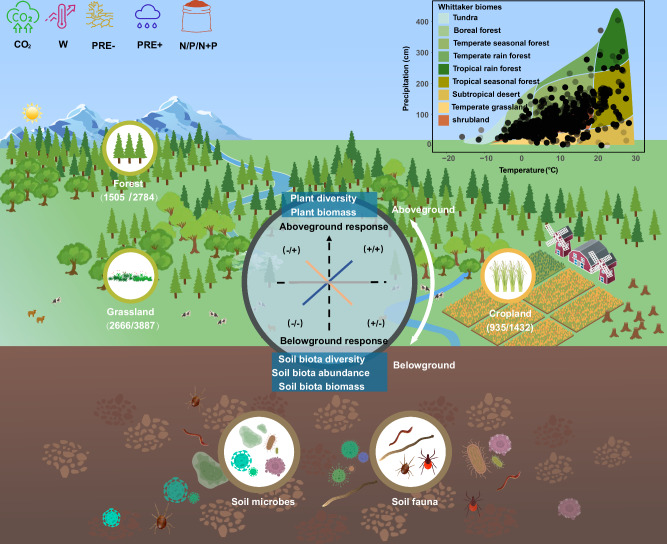
Fig. 1. Conceptual framework of this study showing the relationship between plants and belowground soil organisms in response to GCFs across global forests, grasslands, and croplands.
The diagram in the upper right corner shows the distribution of the study sites in the Whittaker biomes78 mapped based on mean annual temperature and mean annual precipitation. The numbers in parentheses show sample sizes of plants and soil biota, respectively. Lines in different colors show the hypothetical relationships between the plant and soil-biota responses under GCFs; the dark blue line indicates a positive correlation between plant and soil-biota responses, the yellow line shows a negative correlation, and the gray line shows no significant relationship. CO2, elevated CO2; W, increased temperature; PRE-, precipitation reduction; PRE +, precipitation addition; N, nitrogen fertilization; P, phosphorus fertilization; N + P, nitrogen plus phosphorus fertilization. Symbols of global change factors, plants, soil microbes, and fauna were created by Qingshui Yu and Chenqi He.

