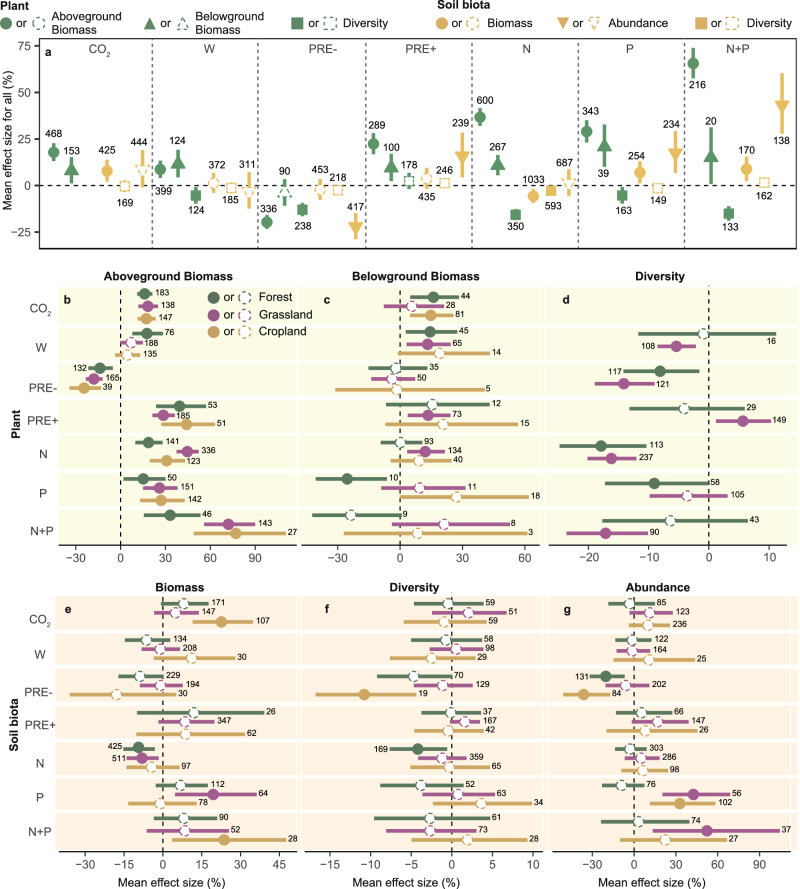
Fig. 2. Responses of attributes of plant and soil biota to GCFs among global forests, grasslands, and croplands.
a Mean effect sizes of plant and soil biota attributes under GCFs across all (combined forests, grasslands, and croplands) ecosystems. Green shapes indicate plant attributes, and yellow are soil biota attributes. Circles, regular triangles, squares, and inverted triangles denote plant aboveground biomass or soil biota biomass, plant belowground biomass, diversity, and abundance, respectively. b–d Effect sizes on plant aboveground biomass, plant belowground biomass, and plant diversity under GCFs among global forests, grasslands, and croplands. Different colored circles indicate various biomes. e–g Effect sizes of biomass, diversity, and abundance of soil biota under GCFs among global forests, grasslands, and croplands. Closed shapes are statistically significant and open shapes are not significant. Weighted means and their 95% confidence intervals of effect sizes are given. Numbers are sample sizes for each global change factor.

